
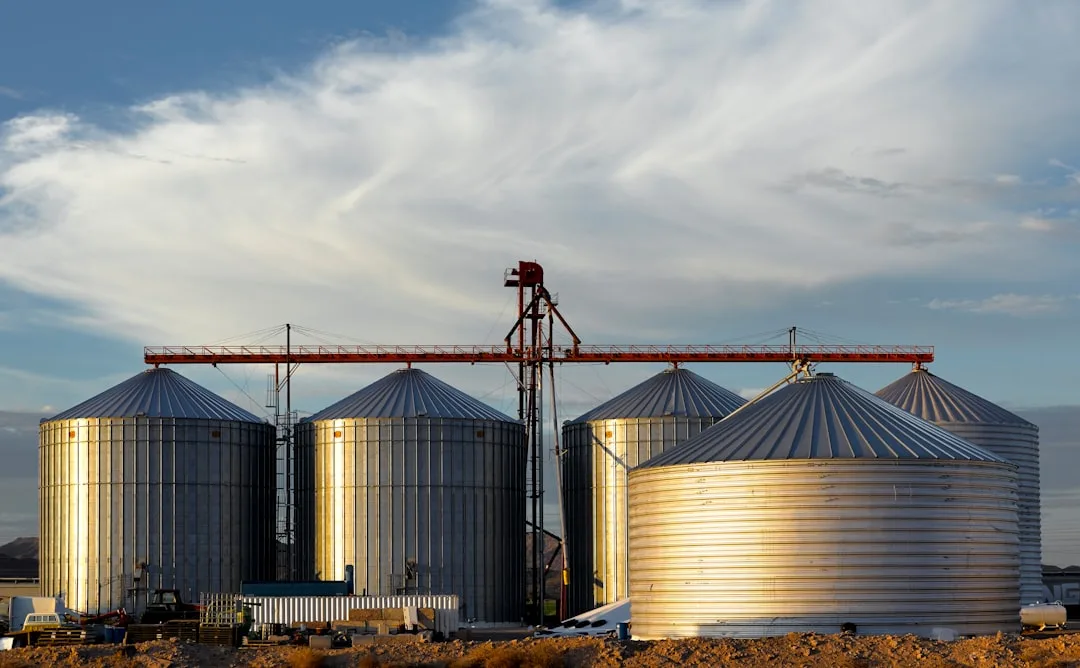
Seasonal price patterns are the rhythm of row crop markets. Corn and soybean prices move in predictable cycles tied to harvest timing, storage availability, and export demand. Understanding seasonal price patterns means you stop chasing day-to-day noise and instead position your sales and storage around the structural forces that actually move the market. This knowledge alone can add hundreds or thousands of dollars to your bottom line.
Understanding seasonal price patterns in supply and demand cycles
Every year, corn and soybean prices follow a recognizable pattern. Right after harvest, supply floods the market, and prices typically fall as elevators and producers compete to move grain. Storage becomes cheap and abundant in those first months.
As months pass and stocks are drawn down by exports, feed demand, and industrial use, supplies tighten. Prices often rise in late winter and spring before the next crop arrives. This is not random. It is the mechanical result of how much grain exists in the system at any given moment.
Understanding this rhythm means you can plan sales windows instead of reacting to weekly rallies. Many farmers sell too early in the season out of habit or anxiety, leaving money on the table when seasonal patterns suggest waiting would have paid better.
Quick Tips
- Track historical price highs and lows by month for your state over the past five years to see when your seasonal window typically peaks.
- Store grain harvested in September and October if your cash flow allows; seasonal patterns often reward patience.
- Use forward contracts or hedge tools to lock in mid-to-late winter or spring prices if seasonal patterns suggest strength ahead.
- Compare your local basis spread against seasonal norms; a wider basis in winter may cancel out a higher national price.
Marketing-Year Timing and Storage Costs
The USDA marketing year runs October 1 through September 30 for corn and soybeans. This calendar is not arbitrary—it aligns with when the new crop arrives and when the old crop is exhausted. Your storage and sales decisions must account for this timeline.
Early-season prices often do not reflect true crop value because uncertainty about total supply and quality is still high. By November or December, after harvest finishes and quality is known, the market reprices the crop more fairly. Waiting to sell a portion of your grain until mid-to-late season often rewards producers who can store.
Storage costs—elevator fees, in-bin drying, shrinkage, insurance—are real. But seasonal price appreciation typically outpaces storage expense during the first six months of the marketing year. A 15- to 25-cent seasonal price rise easily covers reasonable storage costs. See our piece on why marketing-year-average price matters more than monthly swings for how to frame your long-term revenue target.
| Period | Typical Price Pressure | Sales Strategy |
|---|---|---|
| September–October (harvest) | High supply, downward | Store if possible; sell only need-to-move bushels |
| November–December | Supply known, steadier | Begin staged sales or forward contracts |
| January–March | Stocks shrinking, demand peaks | Often higher; seasonal strength typical |
| April–August | Old crop depleting, new crop risk | Sell remaining stock; watch weather risk |
| August–September (pre-harvest) | New crop uncertainty, volatility | Hedge if needed; avoid new-crop overcommitment |
The Most Common Mistake — Panic Selling at Harvest
The biggest money leak in row crop sales is panic selling at harvest. Elevators are crowded. Your bin space is full. Transport lines form. Prices look weak because supply is enormous.
Many farmers sell 70% of their crop in September and October, right into the seasonal price trough. They tell themselves they need the cash for bills or next year's inputs. Six months later, when seasonal strength arrives and prices are 30 or 40 cents higher, they watch and regret.
Here is the concrete problem: If you sold 1,000 bushels of corn at $4.20 in October when the seasonal pattern typically peaks at $4.50–$4.70 by February, you left $300–$500 on the table on that load alone. Multiply that across your whole operation.
The fix is cash flow planning. Know your input and debt obligations six months ahead. Arrange lines of credit or deferred payment plans so you are not forced to dump grain at the exact moment the seasonal pattern tells you to hold. This is not gambling; it is respecting the mechanical structure of the market.
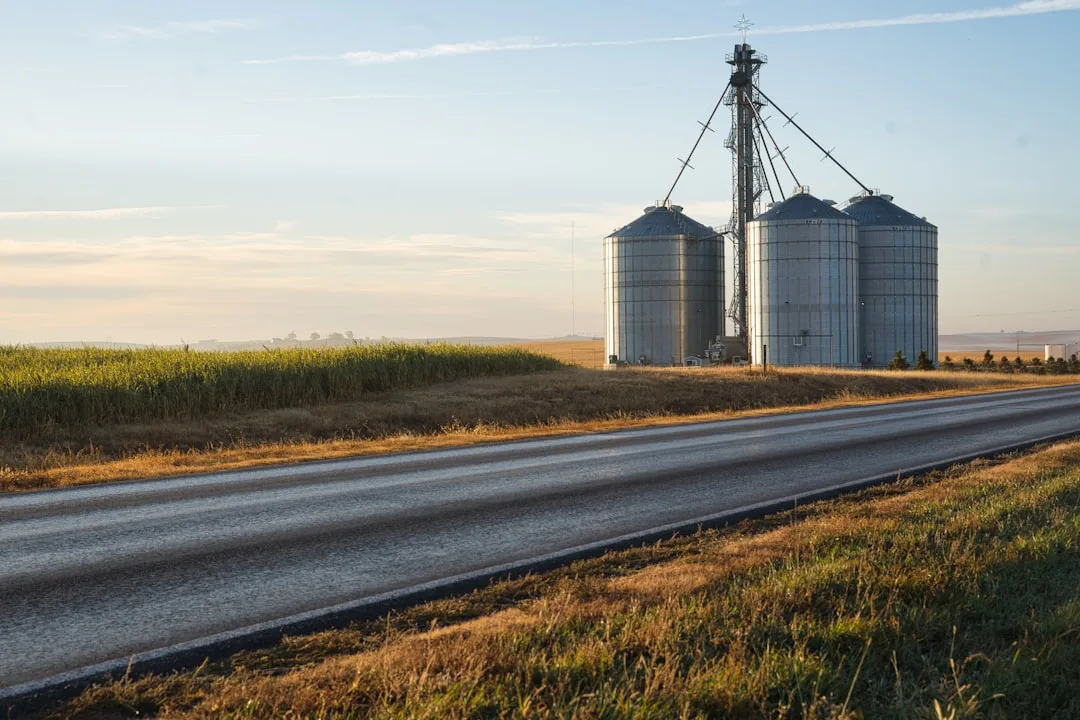
Export and Global Demand Windows
U.S. corn and soybean exports drive seasonal price movement. Northern Hemisphere winter and spring—December through March—is peak export season for South American corn and Brazilian soybeans. During those months, U.S. exporters often compete for sales.
But spring and early summer bring South American harvest and Argentine corn exports. Price pressure builds. U.S. export pace slows. This seasonal inversion is predictable and affects your options.
Knowing when global demand windows open and close helps you decide whether to hold grain through a known period of weakness or forward contract into a known strength window. You are not speculating; you are adjusting your sales calendar to align with market structure, not against it.
Using Basis Patterns With Seasonal Price Cycles
Basis—the difference between your local elevator price and the Chicago futures price—also has a seasonal pattern. Basis is typically widest (most unfavorable) in harvest season when supply is local and transportation is congested. Basis tightens in winter and spring when elevators compete harder for grain and transportation is easier.
This means waiting to sell grain also improves your basis in many years. A narrower basis in January combined with a higher futures price can multiply your revenue gain. Learn how crop price volatility hedging protects row crop revenue if you want to lock in gains without taking additional basis risk.
Check your state's current price and compare your local basis against seasonal norms from prior years. If your current basis is wider than the five-year average for that month, it is telling you something about local supply and transport conditions. Use that signal to refine your timing.
Building a Seasonal Sales Calendar
Create a simple spreadsheet or calendar that tracks your state's historical high and low prices by month over the last three to five years. Your USDA state office publishes monthly average prices; any pattern becomes visible quickly.
Then build your own seasonal sales plan. Decide in advance what percentage of your crop you will sell in each quarter, or which months you will hold and which you will sell. This removes emotion from the decision when prices fall in October or spike temporarily in November.
Share this plan with your lender and crop adviser. They can help you arrange working capital and forward contracts to support the plan. When you stick to a pre-set seasonal strategy instead of reacting daily, your decisions align with market structure, not fear.
Seasonal price patterns are not guaranteed year-to-year, but they are real, repeatable, and powerful enough to be worth organizing around. Farmers who respect these rhythms and plan accordingly consistently outperform those who sell on panic or habit.
Try the Calculator
Estimate gross revenue at this month's price or the marketing-year-average.
Gross revenue only, not net income. Prices: USDA NASS national price received, Aug 2026 (updated automatically). Check your state's current price →
Check your state's current price: Check your state's current price.
Frequently Asked Questions
Why are corn and soybean prices lower right after harvest?
Harvest floods the market with new supply just as old-crop stocks are still abundant. Elevators and producers compete to move grain, pushing prices down. This seasonal dip is mechanical, not a sign of weakness in the crop.
What months typically see the highest seasonal prices for corn and soybeans?
Late winter and spring—January through March—often show strength as harvest supply diminishes and exports peak. Summer sees weakness as new-crop uncertainty and South American exports increase. Check historical data for your state, as regional patterns vary.
How much storage cost is reasonable if I hold grain past October?
Typical in-bin storage and handling costs run 2–4 cents per bushel per month, depending on your setup and energy costs. A seasonal price gain of 15–25 cents over four months easily covers those costs and leaves profit.
Can I use forward contracts to lock in seasonal price strength?
Yes. Once you see seasonal strength building—often by December or January—forward contracting allows you to sell stored grain at higher prices without physically moving it. This pairs seasonal patience with price certainty.
Does basis change seasonally, and should I account for it?
Yes. Basis is typically wider (worse for you) at harvest and narrows in winter and spring as elevators compete harder. Waiting to sell can improve both your futures price and your basis relative to the national market.
What if I have a cash flow crisis and must sell grain right after harvest?
Plan ahead by setting up lines of credit or deferred payment arrangements with your lender for input costs and debt service. This flexibility lets you avoid forced sales into harvest seasonal weakness.
Related Articles

Related: Elevator Basis Risk Management Protects Your Row Crop Revenue
Related: Why Your Expected Price and Your Actual Local Return Often Diverge