
Your soil phosphorus level today will not deliver yield next season the way nitrogen does. Phosphorus management operates on a two- to five-year accumulation and drawdown clock, and that lag is precisely why most producers miss it. A field testing low in phosphorus will not jump 15 bushels after one application; instead, gradual buildup—or unnoticed depletion—shifts your yield ceiling imperceptibly until you compare three-year averages and realize something structural has changed. This is phosphorus management mechanics at work, and understanding it transforms how you read soil tests and plan your nutrient budget.
Phosphorus management row crops depends on understanding soil test availability
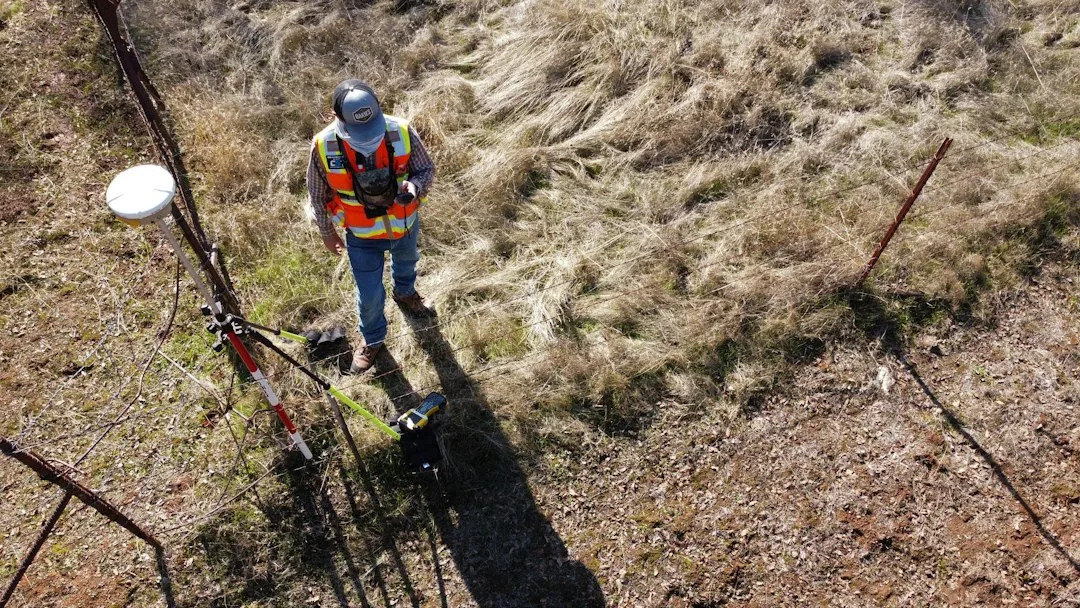
Soil phosphorus comes in two forms: the portion available to roots right now, and the larger reserve locked in mineral and organic matter that becomes available over months and years. Your soil test—typically Mehlich-3 or another extraction method depending on your state lab—measures plant-available phosphorus, not total phosphorus.
That available pool is what matters for this season's crop. But here is the key: available phosphorus does not stay put. Phosphorus binds to soil particles, moves upward into organic matter, and precipitates into less-available forms based on pH, calcium, iron, and aluminum content.
A field with a soil test reading of 15–20 ppm phosphorus (parts per million) in the Midwest, for example, is typically considered sufficient for one corn season, meaning your crop should find enough at the root zone without yield penalty. But sufficiency is not the same as abundance, and sufficiency assumes normal growing conditions and no compaction-induced root restriction.
Quick Tips
- Soil test every 3–4 years minimum; every 2 years if you are tracking a buildup or depletion trajectory on a specific field.
- Request phosphorus extracted via your state lab's standard method—results are not directly comparable across extraction methods, so consistency matters more than the exact figure.
- Pair phosphorus results with soil pH and organic matter; phosphorus availability changes with both.
- Plan phosphorus application for fall or early spring, not sidedress during the season; phosphorus moves slowly, and you need months for root colonization before peak demand (V8–VT in corn, V5–R2 in soybeans).
Phosphorus Application Timing and Crop Demand Peaks
Corn and soybeans take up phosphorus rapidly between emergence and mid-pod (or mid-grain fill in corn), with the steepest demand between V8 and tasseling in corn, and between V5 and R2 in soybeans. If phosphorus is not available in the root zone by then, yield loss is nearly impossible to recover.
This is why timing matters. Fall applications allow phosphorus to equilibrate with the soil matrix over winter, increasing the fraction available when roots intensify uptake in late spring and early summer. Spring applications—especially if worked in before planting—also allow weeks of equilibration, but they leave no buffer if cold, wet soil delays root function in May.
Sidedress phosphorus during the season is a common mistake. Once a crop is past V6, its root system is already set, and phosphorus moves through soil so slowly that mid-season applications rarely deliver available phosphorus to the existing root zone before physiological maturity.
| Application Timing | Equilibration Period | Typical Readiness |
|---|---|---|
| Fall (Sep–Nov) | 4–6 months | Full season available by V8 |
| Early Spring (Mar–Apr) | 6–8 weeks | Partial by V6; full by V10 |
| At Planting (same day) | 2–4 weeks | Variable; frost/rain delays uptake |
| Sidedress (V4–V8 corn) | <3 weeks before peak demand | Often insufficient; low ROI |
Detecting Phosphorus Depletion Before Yield Falls
The most frequent failure mode is ignoring phosphorus because two or three good seasons feel normal. A field with a soil test of 10–12 ppm phosphorus in high-yield regions (Iowa, Illinois, Minnesota) is mining phosphorus: the crop is removing more phosphorus (in grain and biomass) than you are replacing.
Over five to seven years of mining at typical corn and soybean removal rates, that field's available phosphorus can drop another 5–8 ppm, pushing it into the deficiency range. By then, you may not recognize the cause because yield decline is gradual and often blamed on weather or genetics.
To catch this early, compare soil test phosphorus year-to-year on the same fields. If phosphorus is not rising or holding stable, you are mining. Calculate removal: corn grain removes roughly 0.3–0.4 lbs P₂O₅ per bushel; soybeans remove 0.6–0.8 lbs P₂O₅ per bushel.
Phosphorus Buildup Strategy and Long-Term Yield Stability
Once you identify a field trending downward in phosphorus, a buildup strategy typically spans two to four years. Applying phosphorus above removal rate accumulates in the soil and raises the available fraction, but results are not visible in a single season.
For example, if a field test shows 12 ppm phosphorus and you remove 50 lbs P₂O₅ per acre annually, applying 80–100 lbs P₂O₅ per acre per year (as phosphate fertilizer, manure, or a combination) runs a 30–50 lbs surplus annually. After three years, the cumulative buildup—plus equilibration into the available pool—will typically raise that 12 ppm reading toward 18–22 ppm, assuming soil organic matter and pH remain stable.
Manure is a legitimate route if you have access; one ton of solid dairy manure supplies roughly 3–5 lbs P₂O₅. A 20-ton application supplies 60–100 lbs P₂O₅ and organic matter, making it an efficient long-term strategy.
Building phosphorus does not increase next season's yield if your field is already at sufficiency. But it does protect your yield ceiling for the next five to ten years by ensuring the available pool never falls into deficiency.
Reading Your Soil Test and Planning Multi-Year Phosphorus Action
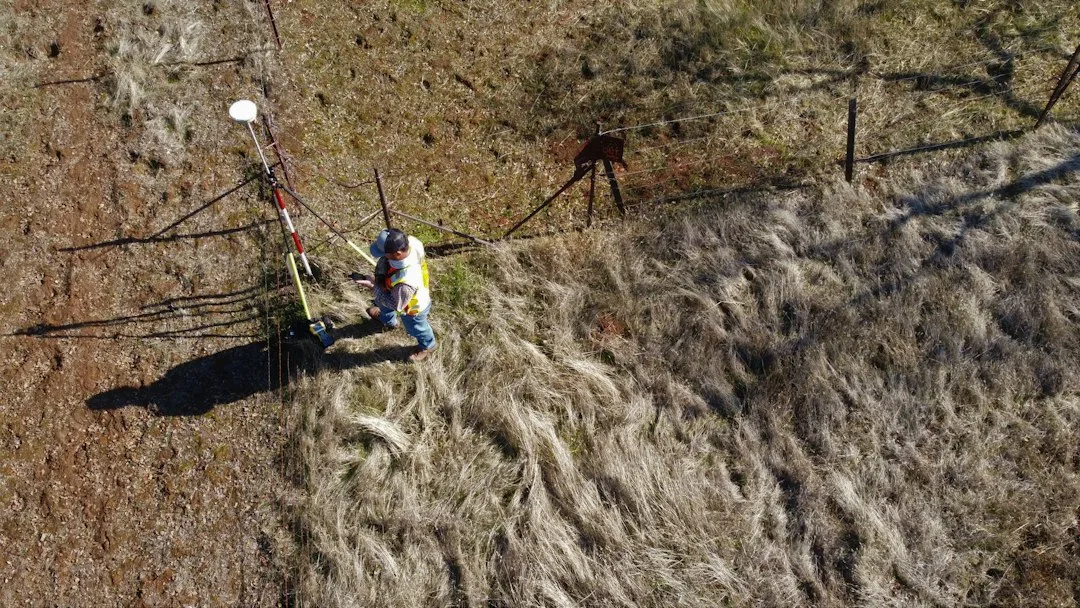
Soil sampling frequency drives precision nutrient management decisions, and phosphorus interpretation is no exception. Take samples every 3–4 years at minimum on every field; every 2 years if you are tracking a specific buildup or depletion trajectory.
Request that your lab report phosphorus in ppm (or mg/kg—same unit) and include soil pH and organic matter in the same report. Phosphorus availability is sensitive to pH: acidic soils (below 6.0) lock phosphorus into iron and aluminum compounds; alkaline soils (above 7.5) bind phosphorus to calcium. Organic matter acts as a slow-release reserve, so a field with 4% organic matter and 15 ppm test phosphorus has more long-term buffering than a field with 2% organic matter and the same test level.
Once you have three years of phosphorus test data on a field, plot the trend. Are you building, holding steady, or declining? That trend is your signal for action: continue maintenance rates if stable, increase applications if declining, or hold steady if already building.
Phosphorus management is unsexy because it works in years, not weeks. But cover crop selection mechanics shape your soil and winter resilience, and the same patient, data-driven approach applies to phosphorus. Your yield ceiling ten years from now is being set by decisions you make today about whether you are building, maintaining, or mining your phosphorus reserve.
Fertilizer Source Selection and Application Method
Phosphorus fertilizers vary in solubility and cost. Monoammonium phosphate (MAP, 11-52-0) and diammonium phosphate (DAP, 18-46-0) are soluble, fast-acting sources commonly used for starter fertilizer (placed at or near the seed at planting). Ordinary superphosphate (0-20-0) and triple superphosphate (0-46-0) are granular broadcast sources suitable for fall or early spring application.
Rock phosphate is insoluble and moves into the available pool very slowly, making it a long-term strategy for organic systems or farms with abundant time; conventional operations rarely see ROI within five years.
Manure, compost, and animal byproducts supply phosphorus gradually as organic matter breaks down, creating a slow-release effect that is especially valuable in higher organic matter soils.
Cost per pound of actual P₂O₅ is your comparison metric. A $600 per ton DAP at 46% P₂O₅ costs roughly $13 per pound of P₂O₅; a $60 per ton manure at 3% P₂O₅ costs $20 per pound of P₂O₅ applied at 20 tons per acre. The math depends on price, hauling distance, and your soil's current status—use it to choose the most efficient route for your buildup or maintenance plan.
Frequently Asked Questions
How do I know if my field is deficient in phosphorus?
A soil test phosphorus reading below 12 ppm in most Midwest soils indicates sufficiency is marginal; below 10 ppm is deficient and typically requires immediate buildup. Compare your result to your state university's soil test interpretation scale; thresholds vary by region.
Can I apply phosphorus in-season if my field tests low?
In-season phosphorus application is inefficient because phosphorus moves slowly through soil and roots are already set by mid-vegetative growth. Fall or early spring application allows months for equilibration; if you discover a deficiency mid-season, plan a buildup strategy starting the next off-season.
Does manure replace commercial phosphorus fertilizer?
Manure supplies phosphorus plus organic matter, making it an excellent long-term strategy if access and cost are reasonable. However, manure phosphorus content varies widely (dairy, beef, poultry differ significantly), so soil test regularly to confirm your removal rate is being offset by your manure application rate.
How long does a phosphorus buildup take to show in yield?
A multi-year buildup (two to four years of surplus application) raises soil test phosphorus, but yield response may not be obvious in a single season. Once your test phosphorus is above the sufficiency threshold, continued maintenance applications protect your yield ceiling over the next five to ten years.
What pH affects phosphorus availability the most?
Phosphorus availability is highest in soils with pH 6.0–7.0. Below pH 6.0, it binds to iron and aluminum; above pH 7.5, it binds to calcium. Test soil pH with every phosphorus sample to understand your field's full nutrient story.
Related Articles



Related: How Revenue Protection Harvest Price Option Mechanics Shape Your Coverage
Related: How Actual Production History Records Set Your Crop Insurance Guarantee