
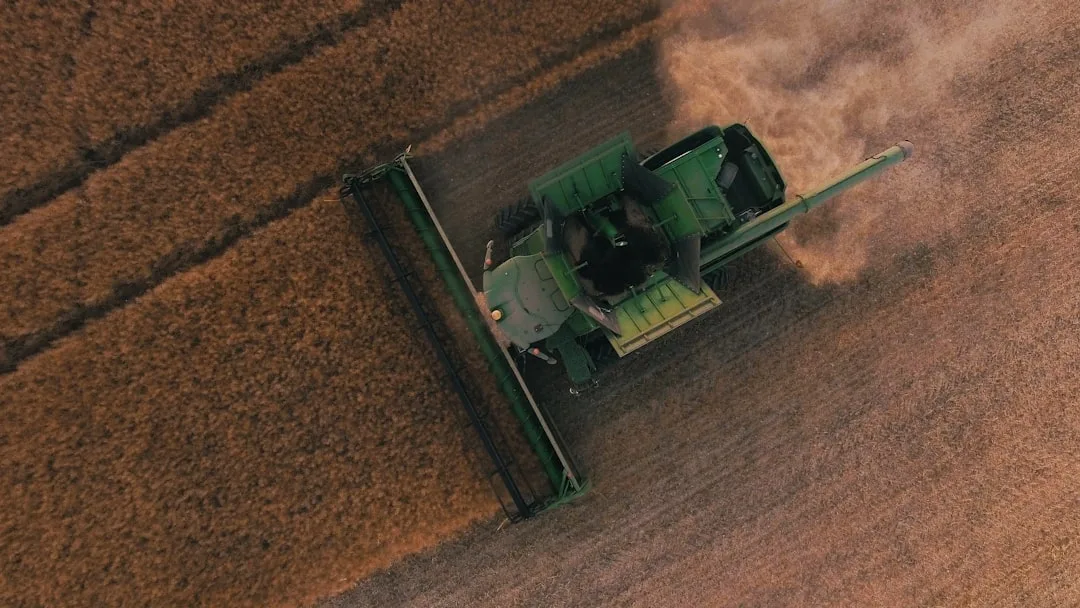
Every yield monitor tells a story. But that story is only as honest as your willingness to sort real agronomic change from noise. Yield data variability sources—the factors that make bushels per acre swing across your field—fall into two camps: things you can manage, and things that just clutter the signal. Learning to separate them is the difference between chasing ghosts and fixing real problems.
Understanding yield data variability sources from measurement error
Yield monitors are not perfect instruments. They estimate grain mass from a sensor reading the grain stream, calculate moisture on the fly, and adjust for forward speed—all at harvest, in dust, at 4 miles per hour. Even new equipment carries a margin of error.
Calibration drift, ground speed errors, and moisture sensor lag introduce noise into your raw data. A poorly calibrated monitor can read 5–10% high or low across the entire field. Dirty sensors, full hoppers, and abrupt speed changes introduce spikes and dips that have nothing to do with your soil or management.
This baseline variability is real but mostly useless. You cannot manage a measurement artifact. Recognizing it as noise—not as a yield problem—keeps you from wasting time chasing a phantom.
Quick Tips
- Calibrate your yield monitor every season using the manufacturer's protocol; run the grain tank empty and refill on a scale.
- Collect 10–20 feet of setup data in each field before recording; skip the first minute and last minute of harvest to reduce edge artifacts.
- Use a 5-acre rolling average or smoothing filter to suppress spikes smaller than your true field variability.
- Store raw data and processed data separately; never delete the raw file, and document your filtering method.
Weather and Seasonal Effects Drive Predictable Yield Swings
Rain timing, drought stress, early frost, and heat waves are not measurement errors. They are real agronomic events that move yield across your fields in predictable patterns—and they are largely beyond your control in any single season.
Dry July reduces pollination and grain fill. Late-season wet spells delay harvest and cause disease. A frost in April kills buds before V4. These events create field-scale or county-scale yield depression that looks dramatic in your data but tells you nothing new about your management system.
To isolate management effects from weather noise, use multi-year trend analysis. Compare your three-year or five-year yield average on a specific field or soil type to see if your true yield floor is moving up or down. A single wet year or dry year obscures the signal.
| Variability Source | Pattern in Data | Management Lever |
|---|---|---|
| Monitor calibration drift | Consistent bias across entire field | Recalibrate; document baseline |
| Regional drought stress | Whole-field or zone yield drop in dry year | Soil moisture retention; irrigation timing |
| Compaction headlands or pivot edge | Repeating low-yield stripe or arc | Traffic pattern; Controlled traffic; cover crop |
| Soil texture or slope transition | Stable spatial pattern across years | Zone management; drainage or soil amendment |
Soil-Driven Yield Patterns Repeat Across Years
The most actionable yield data variability comes from your soil. High clay content, poor drainage, shallow depth, or compacted zones create yield depressions that show up in the same map location year after year, regardless of weather.
A soggy low spot yields 10 bushels less in a wet year and 5 bushels less in a dry year—but it always underperforms the higher ground. A shallow soil over limestone may yield 15 bushels below the silt loam across the road, season after season.
These patterns are your gold. They are stable, they are mappable, and they respond to practice changes: drainage tile, cover crops, reduced tillage to improve aggregation, or amendments. Soil moisture retention drives yield stability across row crops, and you can measure that stability in your own yield data.
The Most Common Mistake — Chasing Annual Noise as Permanent Yield Loss
Producers often see a 15-bushel dip in a single year and assume they have a lasting problem. They blame last year's cover crop, the new hybrid, the late planting date, or the fertilizer timing. Then they make a major change to fix what was actually just a dry year.
One example: a field dropped 8 bushels in 2024 because of late May frost during corn V2–V4. The grower assumed the no-till system was the culprit and returned to conventional tillage in 2025, spending extra fuel and time for no gain. The frost was county-wide; no-till fields did not suffer more than tilled fields.
Before you change a practice, ask: Does this pattern appear in multiple years? Does it appear only on one soil type or slope? Did my neighbors see the same drop? If you answer yes only to the third question, the problem was not your management—it was weather.
Use Multi-Year Field Maps to Spot Real Signals
Overlay your yield maps from three or more years on top of each other. High-yield zones that appear in the same location every year are your good soil or your best-managed fields. Low-yield zones that repeat are your problem acres.
Yield data interpretation turns raw numbers into field action when you compare patterns across time. A zone that underperforms in wet years but hits target in dry years is likely compacted or poorly drained; one that underperforms every year is likely a soil issue or a consistent management gap.
Once you have identified a repeating spatial pattern, test a practice change on a small section. Strip-till a compacted zone for two years; add tile drainage to a wet spot; run a cover crop on marginal ground. Measure the yield response on that zone in subsequent years. See your state's full yield data for benchmarks on how other producers manage similar soils in your region.
Document Your Filtering and Interpretation Method
Yield data is only actionable if you can defend how you processed it. Note which years you included in your average, which data points you removed as outliers, whether you smoothed the raw data, and what map resolution you used (field-scale, zone-scale, grid cell size).
If you change your method next year—different rolling average, different outlier threshold—your new analysis will not be comparable to the old one. Consistency across years matters more than perfection in any single year.
Keep a simple log: calibration date, method notes, threshold settings. Share it with your agronomist or NRCS representative. Transparency builds credibility and helps you spot real agronomic trends instead of chasing measurement ghosts.
Try the Calculator
Estimate the payback on variable-rate seeding, zone-based fertility, and overlap reduction for your farm.
Estimate only — based on industry-average implementation costs (variable-rate seeding $18/ac, zone-based fertility $22/ac, overlap reduction $9/ac; $12,000 fixed + $17/ac ongoing) and USDA yield benchmarks, not a quote. Prices: USDA NASS national price received, Aug 2026 (updated automatically). See your state's full yield data →
See your state's full yield data: See your state's full yield data.
Frequently Asked Questions
What yield data variability is normal and should I ignore it?
Measurement noise (5–10% of total variation), single-year weather events, and harvest edge effects are normal and not actionable. Spatial patterns that repeat across three or more years, or patterns tied to soil type or topography, are real and worth investigating.
How many years of yield data do I need to see a true management trend?
Three years is the minimum to separate seasonal weather from real field-level trends. Five years is better, especially in variable-weather regions. One year of data is almost useless for management decisions unless a dramatic, field-wide event occurred.
Can I trust my yield monitor data if I have not calibrated it recently?
No. Uncalibrated monitors can drift 5–10% or more, making all your yield numbers unreliable as a baseline. Calibrate every season using the manufacturer's protocol on a certified scale.
How do I know if low yield in a zone is soil, compaction, or just bad weather?
Compare the same zone across at least three years. If it underperforms every year regardless of weather, it is soil or persistent compaction. If it only underperforms in wet or dry years, weather or drainage is the driver.
Should I use yield data to change my planting date or variety every year?
No. A single year of poor yield from a late frost or heat wave is not enough reason to change variety or planting date. Use multi-year averages and compare against your county or regional trends to separate your management from weather noise.
What is the best way to store yield data so I can use it for long-term analysis?
Keep raw yield monitor data in its original format, and separately create processed versions with your filtering and smoothing applied. Document your method, calibration data, and any outliers removed. Store both files so you can revisit or reprocess later.
Related Articles
Related: How Yield Plateau Detection Reveals When Genetics Hit Your Farm Ceiling
Related: Weather-Adjusted Yield Comparison Reveals True Field Performance