
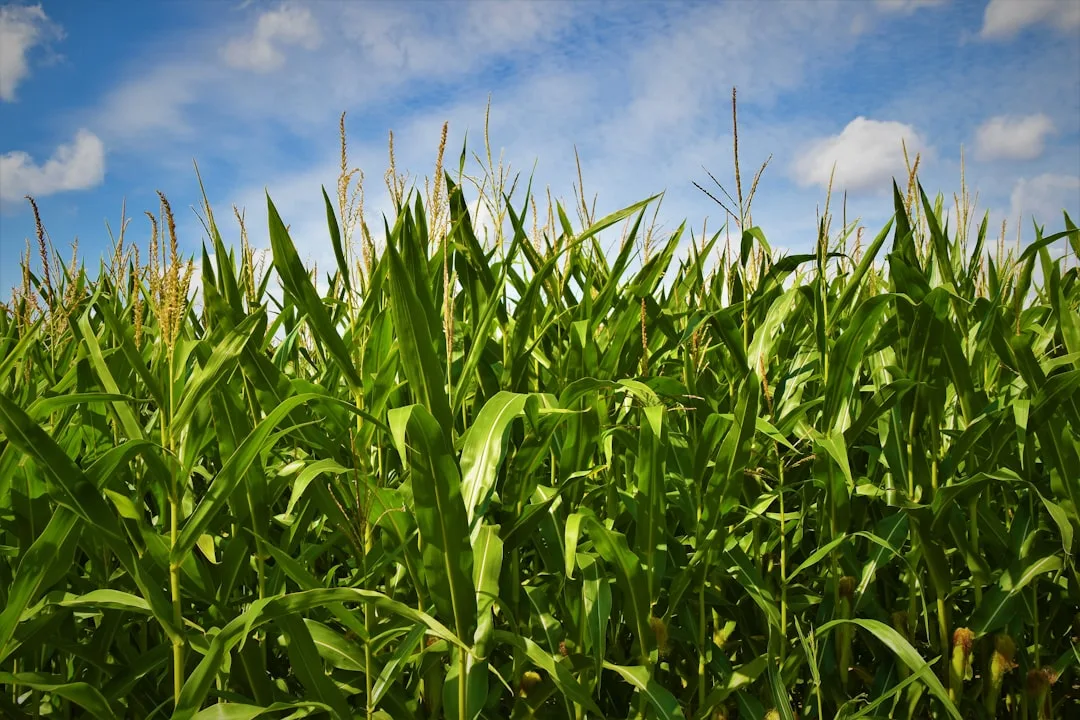
A yield plateau is the point at which your row-crop yields stop rising year over year, despite identical or improved management. It signals that your genetics and field environment have reached equilibrium—the maximum yield your combination of seed variety, soil, weather, and current practices can reliably produce. Recognizing a yield plateau on your own data is not a setback; it is actionable intelligence that tells you exactly when to shift strategy.
See your state's full yield data: See your state's full yield data.
Understanding yield plateau detection and why sustained productivity matters most
Most farmers track their best yield year and try to repeat it. But a one-time spike tells you almost nothing about your farm's realistic ceiling. A plateau—a three- to five-year flat stretch—reveals your true genetic and environmental maximum on that field.
When yields flatten, you have hit the practical limit of what your current seed genetics can extract from your soil and weather. This is not pessimism; it is precision. Knowing your plateau lets you stop chasing yield increases through marginal management tweaks that cost money without lifting bushels.
Your data may show a plateau at 165 bu/ac corn on one field and 148 bu/ac on another, even though you farm them identically. That gap is not random. It is your soil, drainage, compaction history, and microclimate speaking to you in numbers.
Quick Tips
- Plot five years of yield on a simple line chart to see if your line is climbing, flat, or zigzagging—plateau shows as flat.
- Separate good-weather years from bad ones in your data to find your true baseline, not just the peak.
- When you see a plateau, first confirm it spans at least three years and at least two crop rotations (not just one bad season).
- Use your plateau yield as your realistic baseline for ROI calculations on new seed or input trials.
How to Measure and Confirm Yield Plateau in Your Field Records
Plateau detection starts with clean, multi-year yield data. You need at least five years of harvested-area-adjusted yields—actual weight or volume delivered divided by acres planted. If your yields are missing, partial, or averaged across fields with different soil types, stop here and organize your records first.
Once you have the numbers, plot them on a simple spreadsheet or chart. A plateau looks like a line that climbs for two or three years, then flattens into a horizontal band for three or more years. Do not confuse a single flat year with a plateau; weather, pest pressure, or input timing can cause one-off dips.
The strongest plateau signal is a band of yields within a 5 bu/ac range (for corn) or 2 bu/ac range (for soybeans) that repeats for three consecutive years or more. Yield Data Interpretation Turns Raw Numbers Into Field Action explains how to strip out weather noise and see your true field trend.
| Year | Pattern | What It Means |
|---|---|---|
| Years 1-3 | Yield rises 5-8 bu/ac annually | Still climbing; management or genetics improving |
| Years 4-7 | Yield stays within 3 bu/ac band | Plateau confirmed; ceiling likely reached |
| Year 8+ | Yield drops 10+ bu/ac | Soil depletion, pest buildup, or major change |
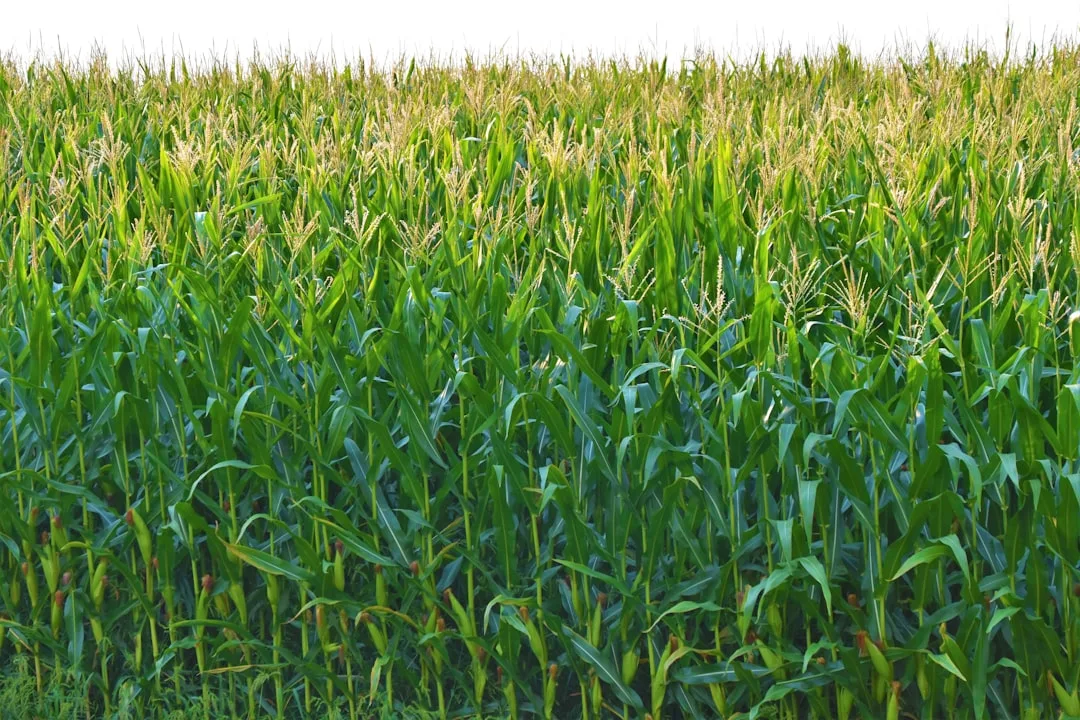
The Most Common Mistake — Mistaking Plateau for Failure and Quitting
The biggest error producers make is seeing a flat yield line and believing they have The biggest error producers make is seeing a flat yield line and believing they have hit a permanent ceiling. In reality, a plateau of 2-3 years often signals stabilization—not failure. This is the moment to interpret yield data to turn raw numbers into field action, rather than abandon the strategy altogether. Many growers stop experimenting precisely when they should be fine-tuning input rates, application timing, or hybrid selection to push past the stall.
Soil Health as the Foundation for Breaking Through Yield Plateaus
A yield plateau frequently reflects the carrying capacity of your soil rather than the limits of your genetics or management skill. Soil structure, organic matter, and microbial activity all influence water infiltration, nutrient availability, and root development. When yields flatten, soil compaction, nutrient imbalance, or declining organic matter often sit at the root of the problem. Addressing these requires a shift from event-driven fertility (applying nutrients on a calendar) to biology-driven fertility (building soil capacity). Soil moisture retention drives yield stability across row crops, making water-holding capacity a critical metric to assess. Improving soil tilth, adding cover crops, or reducing tillage intensity can unlock an additional 5-10 bu/ac by restoring the soil's ability to store water and release nutrients in sync with crop demand.
Diagnostic Tools That Reveal What Your Plateau Is Actually Telling You
Not all plateaus are equal. A yield plateau combined with stable grain moisture and uniform maturity suggests you have achieved equilibrium under your current setup. A plateau paired with delayed grain fill or variable emergence, however, points to a specific constraint—possibly root disease, compaction, or pH drift—that responds to targeted intervention. Tissue sampling, soil testing at multiple depths, drone imagery for canopy uniformity, and harvest-time field mapping all serve as diagnostic lenses. When you have access to these tools and interpret them correctly, a plateau becomes a roadmap, not a dead end.
Try the Calculator
Estimate the payback on variable-rate seeding, zone-based fertility, and overlap reduction for your farm.
Estimate only — based on industry-average implementation costs (variable-rate seeding $18/ac, zone-based fertility $22/ac, overlap reduction $9/ac; $12,000 fixed + $17/ac ongoing) and USDA yield benchmarks, not a quote. Prices: USDA NASS national price received, Aug 2026 (updated automatically). See your state's full yield data →
See your state's full yield data: See your state's full yield data.
Frequently Asked Questions
How is a yield plateau different from a bad weather year?
A single low-yield year from drought or late frost is not a plateau. A plateau is a flat band of yields repeating for at least three years, even as weather varies. Your plateau is the yield range your field reliably produces under normal conditions.
What if my yields zigzag up and down instead of staying flat?
Zigzag patterns usually mean weather and pest pressure are masking your true field trend. Look at the average of the up and down years, and then look at the highest years in that cluster. The highest cluster likely represents your real yield potential for that field.
Can I break a yield plateau without buying new seed?
Yes. Yield plateaus often signal that genetics are at ceiling but soil, drainage, or pest management are not optimized. Soil testing, cover crops, reduced tillage, and drainage work frequently unlock 5-10 bu/ac gains without new hybrid investment.
How many years of data do I need to confirm a true plateau?
At least five years total, with the flat band lasting at least three years. Shorter records cannot rule out weather or management cycles that are not actually plateaus.
Should I use average yield or best-case yield when setting my baseline?
Use the average of your plateau years, not your single best year. Your best year was likely weather-aided and is not repeatable. Your plateau average is what your field actually delivers and is the right number for budget and ROI math.
Related Articles
Related: Weather-Adjusted Yield Comparison Reveals True Field Performance
Related: Year-to-Year Yield Comparison Isolates Real Farm Progress