
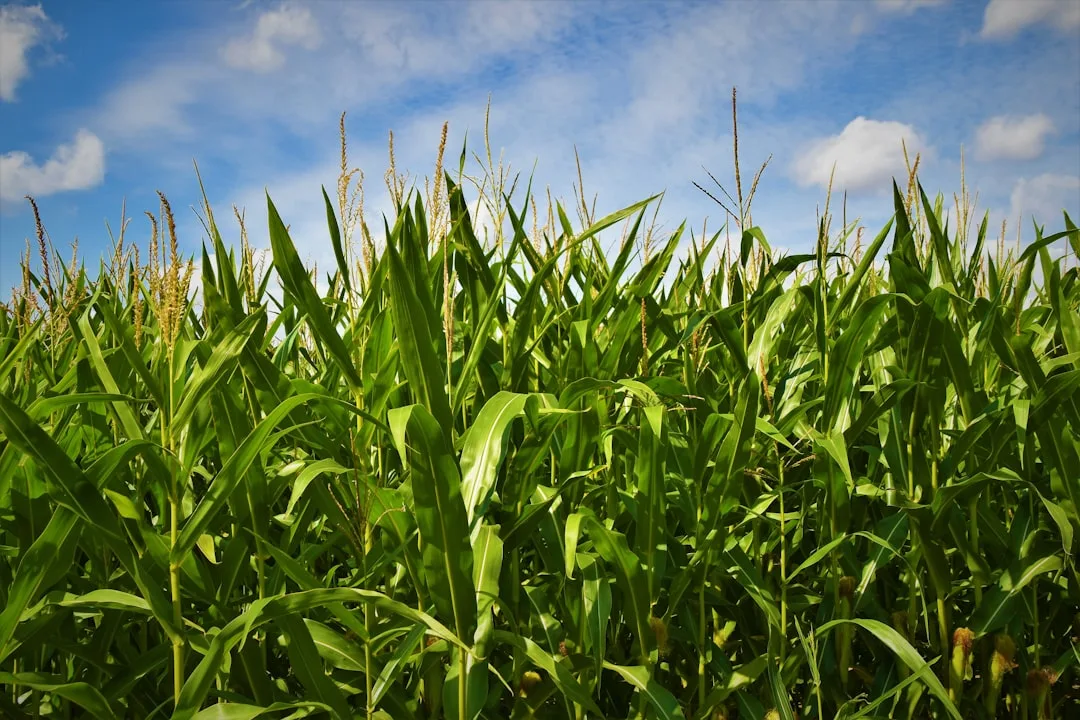
A producer in Ohio harvests 165 bushels per acre in Year 1 and 148 in Year 2. Without context, that looks like a 17-bushel drop—a failure. But if Year 1 saw 28 inches of well-timed rain and Year 2 saw 16 inches of scattered moisture, the story flips. Your actual management performance—seed selection, input timing, pest pressure response—may have improved, but weather-adjusted yield comparison is the tool that proves it.
Most farmers compare raw yields and call it analysis. That approach confuses weather with management. Weather-adjusted yield comparison isolates the yield difference you actually control, removing the noise of rainfall timing, growing-season temperature departures, and freeze dates.
See your state's full yield data: See your state's full yield data.
Understanding weather-adjusted yield comparison for your agricultural data
Weather normalization uses historical climate data for your county to establish a baseline. The USDA climate division data, updated daily during growing season, captures rainfall totals, degree-days above 50°F (the corn growth trigger), and frost events. A normalization model compares your field's actual growing season to the 30-year average.
Isolating Your Management Practices From Weather Effects
When you compare normalized yields across seasons or fields, you're measuring the impact of your decisions—seed selection, planting date, fertility program, pest management, and tillage approach—without the distraction of a wet July or an early frost. A year with below-average rainfall might still show strong normalized yields if your soil moisture retention strategy kept your crops competitive. Conversely, a year with perfect rainfall could mask poor hybrid choice or inadequate nitrogen timing if normalized yields lag your benchmark. This separation lets you identify which management levers actually move your bottom line.
Why Adjusted Yields Matter for Year-to-Year Comparison
Raw yield numbers tempt you to celebrate a bumper crop in a wet year or blame yourself for a poor season in a drought. Adjusted yields reframe that narrative. If your raw yield jumped 15 bushels per acre but weather normalization shows only a 4-bushel gain, you know the weather did most of the work. That insight steers you toward asking harder questions: Did your new soil biology program contribute those 4 bushels? Did your cover crop residue management make a difference? By filtering out weather noise, normalized yields help you build a reliable library of what actually works on your operation.
Building a Benchmark Yield for Your Field
Once you have several seasons of normalized yield data, you can establish a field-specific baseline—your own expected yield when weather is average and management is solid. This benchmark becomes your decision threshold for the season ahead. If soil testing, weather forecasts, or early-season scouting suggest conditions will deviate from normal, you can adjust inputs or tactics. You'll also spot when actual yields fall below your benchmark, triggering an investigation into what went wrong. This feedback loop, grounded in yield data interpretation that turns raw numbers into field action, accelerates your learning across crop cycles.
Connecting Normalized Yields to Soil Health and Input Decisions
Weather-adjusted yields reveal the true return on investments in soil structure, organic matter, and microbial activity. A field with poor water-holding capacity will show lower normalized yields in dry years, even if all other factors are equal. Similarly, if you're testing a reduced-tillage system or a new cover crop mix, normalized yields isolate whether those practices genuinely improve your farm's resilience and profitability. Over time, this data guides you toward practices that raise your benchmark yield—not just in lucky years, but consistently, season after season.
Building a Multi-Year Weather Database for Your Operation
Creating a localized weather adjustment model requires tracking rainfall, growing-degree days, and soil moisture patterns specific to your field coordinates, not relying on county-level averages. Many farm management software platforms now integrate with weather stations—both public and on-farm sensors—to capture the microclimate variations that influence yield across different soil types and topography on your property. By logging these variables alongside your yield maps for 3–5 years, you establish the statistical relationship between weather stress and actual production, allowing you to identify which weather factors matter most for your particular crops and soil profile.
Once you have this baseline, comparing one year's yield to the normalized benchmark becomes straightforward: a drought year might suppress absolute yield by 15 bushels per acre, but your normalized yield calculation accounts for that rainfall deficit and tells you whether your field underperformed or tracked expectations. This comparison prevents false conclusions that might otherwise lead you to abandon a successful input program or soil practice simply because an unlucky year made results look poor. The investment in data collection compounds over time, making your decision-making more confident and precise.
Practical Steps to Implement Yield Normalization on Your Farm
Start by recording your yield monitor data in geographic information system (GIS) format, mapping each field's production alongside your in-field weather observations—temperature extremes, wet periods, irrigation timing, and frost dates. Cross-reference these maps with historical weather data from the nearest weather station and your own sensors to identify correlation patterns; for example, a late spring frost might consistently reduce yields in low-lying zones where cold air settles, while high ground escapes damage. Document any other variables that affect normalized yield, such as pest or disease pressure, equipment issues during harvest, or nutrient deficiency symptoms observed during growth stages.
Next, work with an agronomist or use your software's built-in analytics to establish a regression model that weights each weather factor's influence on your yields. This model doesn't need to be perfect initially—it improves as you add more years of data. After normalizing two or three seasons of yields, you'll begin to see which fields consistently exceed their weather-adjusted potential and which ones fall short, pointing you toward management changes worth testing. Share these normalized benchmarks with your team so everyone understands that a 175-bushel-per-acre year with poor weather was actually an excellent performance, shifting farm culture toward realistic, data-driven expectations rather than being swayed by seasonal luck.
Try the Calculator
Estimate the payback on variable-rate seeding, zone-based fertility, and overlap reduction for your farm.
Estimate only — based on industry-average implementation costs (variable-rate seeding $18/ac, zone-based fertility $22/ac, overlap reduction $9/ac; $12,000 fixed + $17/ac ongoing) and USDA yield benchmarks, not a quote. Prices: USDA NASS national price received, Aug 2026 (updated automatically). See your state's full yield data →
See your state's full yield data: See your state's full yield data.
Frequently Asked Questions
Can I use just rainfall to adjust my yield, or do I need temperature too?
Temperature (degree-days) matters, but rainfall is the dominant factor for most row crops. If you start with rainfall alone, you'll capture 60–70% of the weather effect. Adding GDD pushes you to 85%+ accuracy. For a simple first pass, rainfall ratio is enough; refine with temperature over time.
What if I don't have county-level data? Can I use my own farm's rain gauge?
Yes. A on-farm gauge is even better than county average because it reflects your microclimate. Record weekly totals and save them year-to-year. Compare your farm's actual season total to your own farm's average over time—that's a valid normalization. Regional data is useful for benchmarking, but farm data is best for your own trend.
How many years of weather-adjusted data do I need before I can trust a trend?
Three to five years is the minimum to see a real pattern emerge. Two years can show direction but isn't reliable; weather variability is too high. Five years or more lets you separate decadal climate patterns from your management changes.
Does weather adjustment work the same for soybeans and corn?
Yes, the principle is identical—rainfall and degree-days drive both crops. Soybeans are slightly more drought-tolerant, so the rainfall ratio may be less pronounced, but the method applies. Use soybean-specific GDD if available (some sources use base 50°F, others base 48°F; pick one and stick with it for consistency).
Can I use weather-adjusted yields to compare fields in different counties?
Only if you normalize each field to its own county climate normal first. Then yes—you can compare the adjusted yields to see which field performed better *relative to its local weather opportunity*. Always adjust to local normal; never use a statewide average for a single county field.
If my adjusted yield is lower than raw, does that mean my management is worse than I thought?
No—it means the year's weather was above your long-term average. An adjusted yield lower than raw means you had a favorable weather year. The adjusted figure shows what you'd have yielded in typical conditions, so it's often more honest than raw numbers.
Related Articles
Related: Year-to-Year Yield Comparison Isolates Real Farm Progress
Related: Yield Lag Detection Reveals When Your Farm Falls Behind Regional Pace