
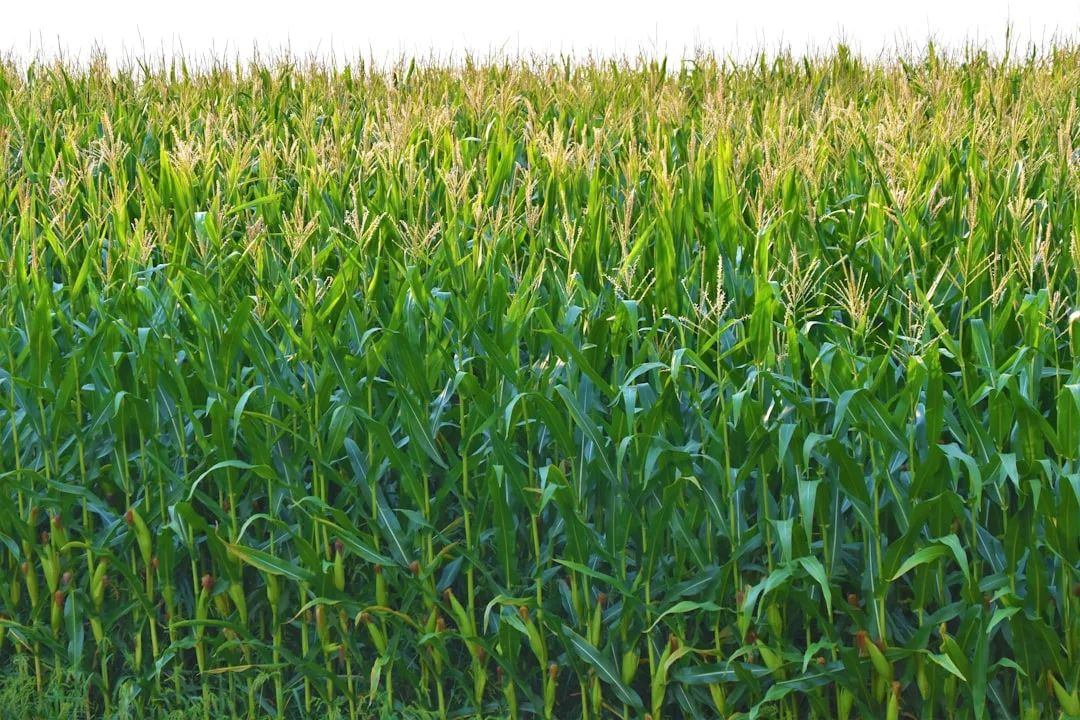
When you pull your combine yield data from one year and compare it to the previous year, you're looking at raw numbers that tell an incomplete story. Year-to-year yield comparison is the practice of reading what actually changed in your farm's performance once you account for weather, variety selection, input rates, and planting decisions. It's the difference between seeing a 4 bu/ac drop and understanding whether that drop came from a dry July or from a decision you made in March.
How Year-to-Year Yield Comparison Works in Practice
A year-to-year comparison isolates one field, one crop, one soil type, and asks: what changed between last year and this year that I can control or measure? Start by locking down five variables: variety planted, seeding rate, planting date, in-season nitrogen timing and rate, and tillage or residue management.
If those five inputs stayed constant but yield jumped 6 bu/ac, weather or pest pressure almost certainly drove the gain. If variety changed, seeding rate dropped 5,000 seeds/acre, and yield held steady, your new variety and spacing offset what might have been a yield boost from better moisture. The comparison forces you to read the interaction, not just the number.
Most farmers remember the yield they harvested—9 bu/ac down or up—but forget or don't document what actually changed in management. That's where the signal gets lost.
Quick Tips
- Record five core variables each season: variety, seeding rate, planting date, N timing and rate, tillage method—before comparing yields across years.
- Separate weather impact from management impact by looking at the same field in wetter and drier years under identical practices.
- Use Yield Data Interpretation Turns Raw Numbers Into Field Action to convert your year-to-year numbers into a management decision.
- Pull regional NASS county-level yield data for the same years to confirm whether your field moved the same direction as the county average.
Why Regional Yield Context Matters for Your Comparison
A 3 bu/ac drop on your farm sounds like a failure until you learn that your county's average yield fell 8 bu/ac the same year. Now your field performed 5 bu/ac better than the average—a win, not a loss.
USDA NASS publishes county-level yield averages each year for corn and soybeans. See your state's full yield data to pull your county's three-year or five-year average yield trend. When you compare your field against that regional baseline across the same years, you're separating farm-specific management from area-wide conditions.
| Scenario | Your Field Yield Change | Interpretation |
|---|---|---|
| Your field up 2 bu/ac; county down 5 bu/ac | +2 vs. −5 regional | Your management choice(s) outperformed area conditions. |
| Your field down 3 bu/ac; county down 3 bu/ac | −3 vs. −3 regional | Weather or pest pressure hit uniformly; management held its own. |
| Your field down 4 bu/ac; county up 2 bu/ac | −4 vs. +2 regional | Your field underperformed the area; a management change likely backfired. |
| Your field up 6 bu/ac; county up 3 bu/ac | +6 vs. +3 regional | You captured the regional gain plus added 3 bu/ac from a practice or input shift. |
The Most Common Mistake — Ignoring Variety and Input Timing
The number one failure in year-to-year yield comparison is comparing two years with different varieties and then crediting the yield change to soil health, cover crops, or tillage. A farmer plants a higher-yielding corn hybrid in year two and sees a 5 bu/ac jump, then assumes the new cover crop residue drove the gain.
The cover crop might help—but you cannot know without holding variety constant. Plant the same hybrid two years in a row, change only the cover crop or tillage, and then measure the difference. Anything else is noise.
Similarly, pushing nitrogen application from pre-plant to V6 stage changes how much N is available during grain fill. A yield jump in year two might reflect improved N timing, not a soil health practice. Document the timing change separately, and your year-to-year comparison stays honest.

Using Multi-Year Patterns to Confirm Real Trends
One-year comparisons catch obvious wins and losses, but a two-year or three-year pattern reveals whether a management change truly sticks. If you strip-till a field in year one and see a 2 bu/ac yield dip compared to the previous conventional-till year, the soil is still settling. In year two, with the same hybrid and N rate, strip-till might show a 1 bu/ac gain as residue biology stabilizes.
Three consecutive years of the same practice under controlled variety and input conditions build confidence. This is why Soil Moisture Retention Drives Yield Stability Across Row Crops matters: a soil health practice may not boost yield in a wet year but sustains yield in a dry year, and a three-year look catches that pattern.
Real progress accumulates quietly. One-year noise is loud.
How to Document and Track Year-to-Year Data
Create a simple spreadsheet for each field: year, variety, seeding rate, planting date, N rate and timing, tillage method, rainfall (from a public weather station), county yield average, and your field's harvested yield. Five columns—variety, seeding, date, N, tillage—become your control variables; everything else is context or outcome.
When you sit down each October or November to plan the next year, pull the prior year's row and ask: what do I change, and what do I hold steady to isolate the impact? If you change two practices, you've muddied the result.
Use your combine's yield map, not rounded estimates. A yield map shows spatial variation within the field; a whole-field average hides whether a low-yielding pocket improved because of your practice change or because you seeded it at a higher rate. Zoom in on the same area year to year.
Why Year-to-Year Yield Comparison Protects Your Bottom Line
Misreading year-to-year data costs money. A farmer adopts an expensive practice because one good year followed it, without checking whether variety, N timing, or favorable weather was the real driver. Year three arrives, the good year doesn't repeat, and the practice gets blamed for no yield gain—even though it was never the cause.
A clear year-to-year comparison logic keeps you from chasing phantom solutions or abandoning practices that actually work. You invest in changes only when data from multiple years under controlled conditions shows they stick. That's how yield progress becomes predictable instead of accidental.
Start simple: lock down five management variables, compare the same field across two full seasons, and measure your field against your county's trend. Everything else is just noise trying to sound like wisdom.
Try the Calculator
Estimate the payback on variable-rate seeding, zone-based fertility, and overlap reduction for your farm.
Estimate only — based on industry-average implementation costs (variable-rate seeding $18/ac, zone-based fertility $22/ac, overlap reduction $9/ac; $12,000 fixed + $17/ac ongoing) and USDA yield benchmarks, not a quote. Prices: USDA NASS national price received, Aug 2026 (updated automatically). See your state's full yield data →
See your state's full yield data: See your state's full yield data.
Frequently Asked Questions
What's the difference between year-to-year yield comparison and yield trend analysis?
Year-to-year compares two adjacent seasons and isolates which management variables changed. Yield trend analysis looks at three or more years to spot slow improvements or declines. Both matter, but year-to-year is sharper for diagnosing a single decision's impact.
How do I know if a yield change was weather or management?
Compare your field's year-to-year change against your county's average yield change for the same years. If your county fell 5 bu/ac but your field held steady, management protected you. If both fell equally, weather was the main driver.
Should I compare yields if I used different varieties in each year?
Not reliably. Variety genetics are one of the largest yield drivers and will mask or fake the impact of practices like cover crops or tillage. Hold variety constant for two or three years, then swap and measure the new variety's impact separately.
Can I use USDA NASS county data instead of my own field map?
County data shows you how your region performed and helps you understand area-wide conditions, but it cannot replace your field data. Use NASS as context to explain whether your field outperformed or underperformed the average.
What if my field has high variability—some spots are always high, others low?
Use your combine's yield map to compare the same zones within the field across years. If the northeast corner always yields 3 bu/ac higher than the southwest corner, track that zone's trend separately to isolate true management impacts.
Related Articles
Related: Yield Lag Detection Reveals When Your Farm Falls Behind Regional Pace
Related: Field-Level Yield Mapping Reveals Where Your Farm Underperforms