
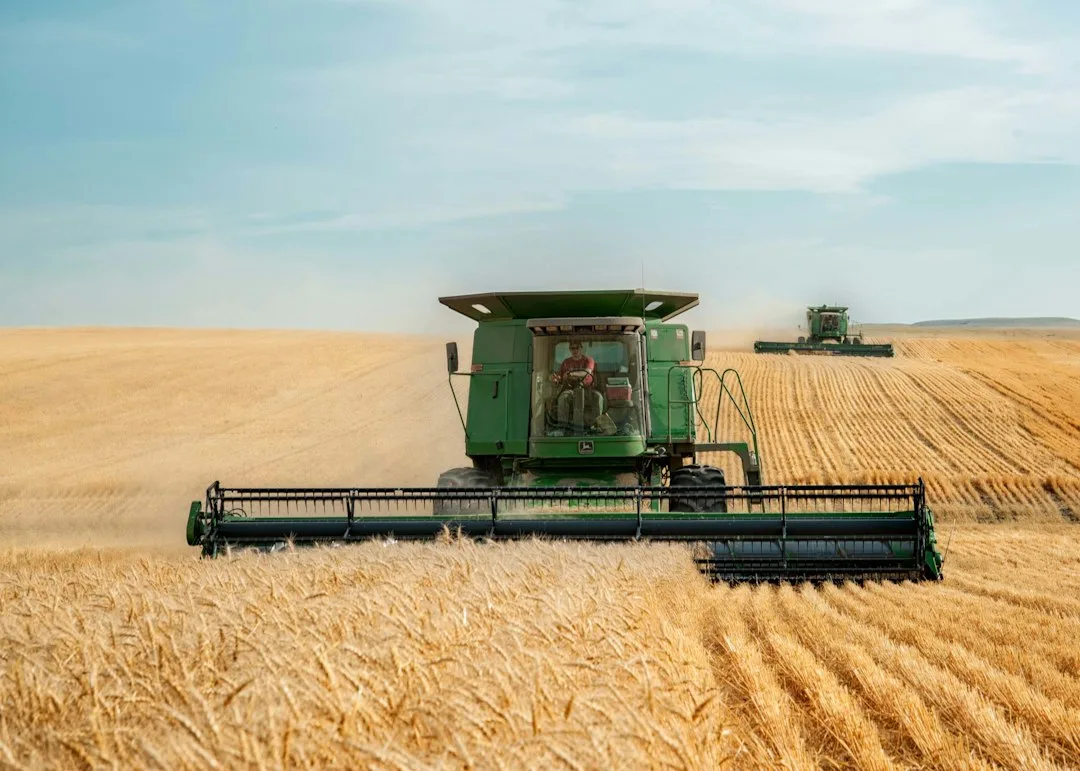
Your yield monitor reports grain that reached the tank, not grain that fell on the ground. A combine can drop a meaningful share of a crop and still produce a clean-looking yield map. Harvest loss measurement closes that gap by putting a number on what escaped before it was weighed.
Why Harvest Loss Measurement Matters Beyond Your Monitor
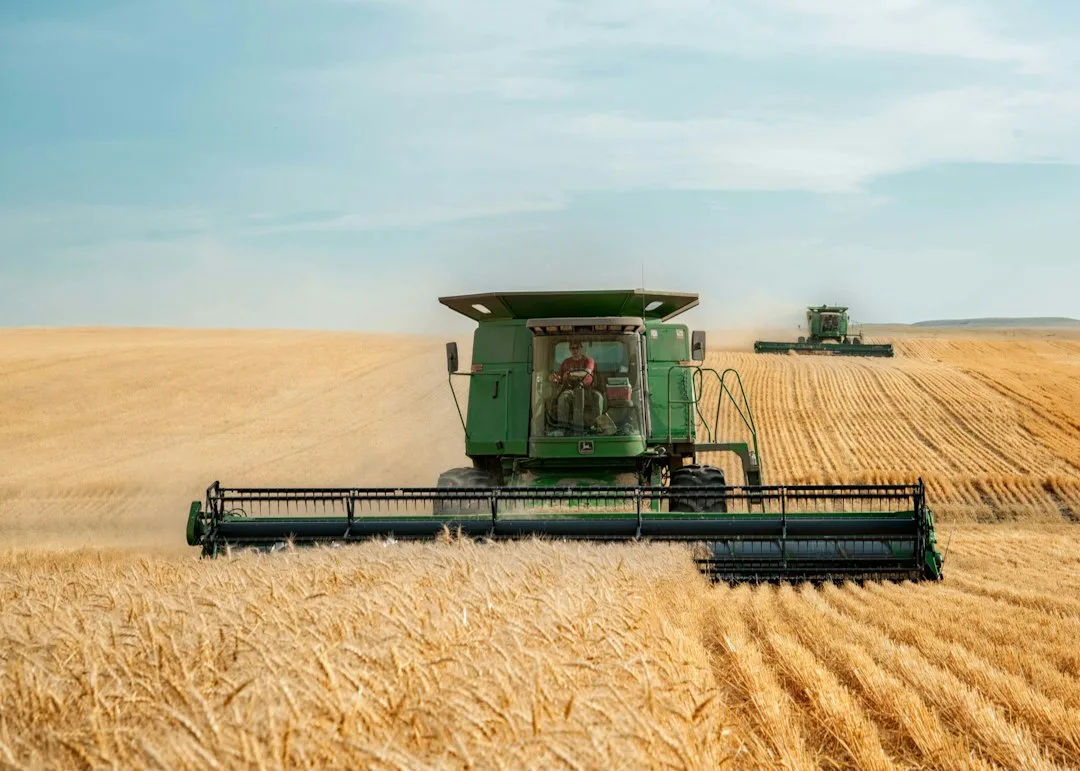
A yield monitor measures grain flow at the clean grain elevator, so anything lost ahead of or behind that point stays invisible. Losses come from four main places: the header, the gathering chain and reel, the cleaning shoe, and the rear spreader or chopper. Each source responds to different adjustments, so you need to know which one is leaking.
Small losses are easy to dismiss because they look trivial in any single pass. Across hundreds of acres, though, a steady leak adds up to real money at harvest prices. Measurement turns a hunch into a number you can compare across fields and seasons.
Quick Tips
- Test on the same crop moisture and similar days as your baseline so results stay comparable.
- Check at least three locations per field, not just the first pass near the road.
- Log header height, reel speed, fan speed, and sieve settings with every test.
- Record weather and lodging notes alongside each loss number.
How to Run a Pan Test Behind the Header
The most common field method uses a tarp or pan of known area placed under the header and another behind the rear of the machine. Collect all grain and loose seed within a measured frame, then count or weigh the material. Extension publications provide conversion tables that turn a count within a known frame into bushels per acre.
Run the combine at normal operating speed while you collect samples, not at a crawl. Parking the machine or slowing down changes loss patterns, so the reading will not match real harvest conditions. Sample at several points spaced across the header width where possible.
Keep a simple log with the date, field name, crop moisture, and machine settings. Repeat the same method next season so the numbers stay comparable year to year. Consistency matters more than precision on any one test.
Where Losses Concentrate Across Your Fields
Loss sources tend to show up in predictable places, and the table below summarizes what to check first. Use it as a starting point when a test reading seems high. Adjust based on your own machine and crop.
| Loss Source | Where to Check | Common Adjustment Area |
|---|---|---|
| Header | Ground under the cutterbar | Cutting height, ground contact, reel speed |
| Gathering | Rows directly behind the header | Row unit alignment, stalk handling, lodging response |
| Cleaning | Tarp at the rear sieve area | Fan speed, sieve opening, airflow |
| Rear distribution | Strip behind spreader or chopper | Spreader settings, residue spread pattern |
Header loss often rises when cutting height drifts over uneven ground or when reel speed runs too fast for the crop. Gathering loss climbs in lodged or tangled stands where stalks do not feed cleanly. Both problems tend to cluster in specific spots, which is why field-wide averages can hide them.
The Mistake of Testing Once and Trusting the Average
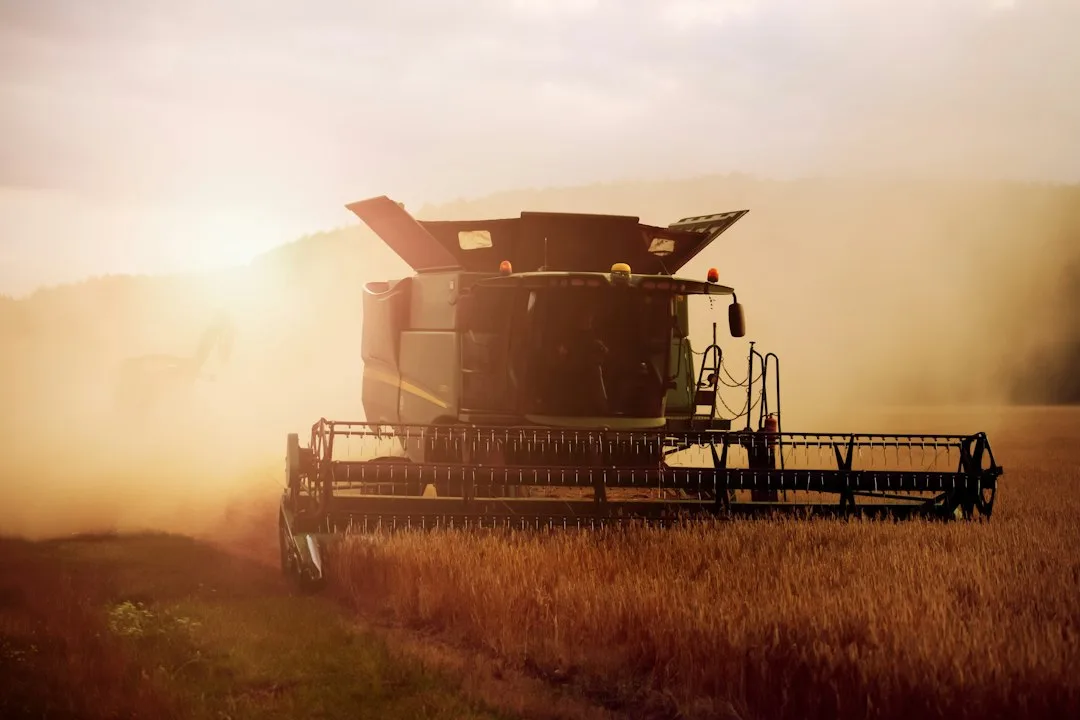
The most costly error is running one test in a convenient spot and applying that number to the whole field. For example, a single sample taken where the crop stood upright and ripened evenly may look excellent. Meanwhile, a low wet corner or a lodged strip nearby could be losing far more.
Lodged areas, low wet spots, and field edges almost always behave differently from the field center. A useful habit is to test in at least three zones: normal stand, problem area, and headland. Compare the results before deciding whether to adjust the machine.
Turning Loss Readings Into Field Decisions
Once you have loss numbers, pair them with your yield map for the same field. A field that yields well on the monitor but carries high measured loss may have a machine problem rather than a genetics or soil issue. The pairing tells you whether the fix belongs in the combine setup or the field plan.
Track loss by field and by year so patterns become visible. Over several seasons, a field with chronic header loss may warrant a different harvest approach or a different planting date. For the next step in connecting these numbers, read Yield Data Interpretation Turns Raw Numbers Into Field Action.
To compare your harvest results against regional patterns, See your state's full yield data for the exact figures in your area. Our data pages show current numbers, which change every season.
How Weather and Crop Stand Change Loss Rates
Dry, standing crops shatter more easily, which makes harvest timing a loss variable. Waiting too long on a dry crop often costs more than a few extra days of field drying would. Stand health matters too, because soil water during grain fill affects how firmly kernels or pods hold.
Soil water conditions during the season shape stand strength and maturity uniformity. For background on how moisture supports stable yields, read Soil Moisture Retention Drives Yield Stability Across Row Crops. Stronger, more uniform stands tend to lose less at harvest.
Try the Calculator
Estimate the payback on variable-rate seeding, zone-based fertility, and overlap reduction for your farm.
Estimate only — based on industry-average implementation costs (variable-rate seeding $18/ac, zone-based fertility $22/ac, overlap reduction $9/ac; $12,000 fixed + $17/ac ongoing) and USDA yield benchmarks, not a quote. Prices: USDA NASS national price received, Aug 2026 (updated automatically). See your state's full yield data →
See your state's full yield data: See your state's full yield data.
Frequently Asked Questions
How do you measure harvest loss on a combine?
Place a tarp or pan of known area under the header and behind the rear of the machine while running at normal speed. Collect and count or weigh the grain within a measured frame, then convert the result to bushels per acre using extension conversion tables.
Does a yield monitor already count harvest loss?
No. A yield monitor measures grain that reaches the clean grain elevator, so grain dropped by the header or lost through the rear of the combine is not included.
How often should I run a pan test?
Test at the start of harvest, after major machine adjustments, and when crop conditions change, such as a dry spell or a lodging event. Repeat the same method each season so results stay comparable.
Why do loss readings vary across the same field?
Lodged areas, low wet spots, uneven header height, and field edges all change how much grain sheds. Testing several zones gives a more accurate picture than a single sample.
Related Articles

Related: Why Planting Date Yield Response Costs More Than Expected