
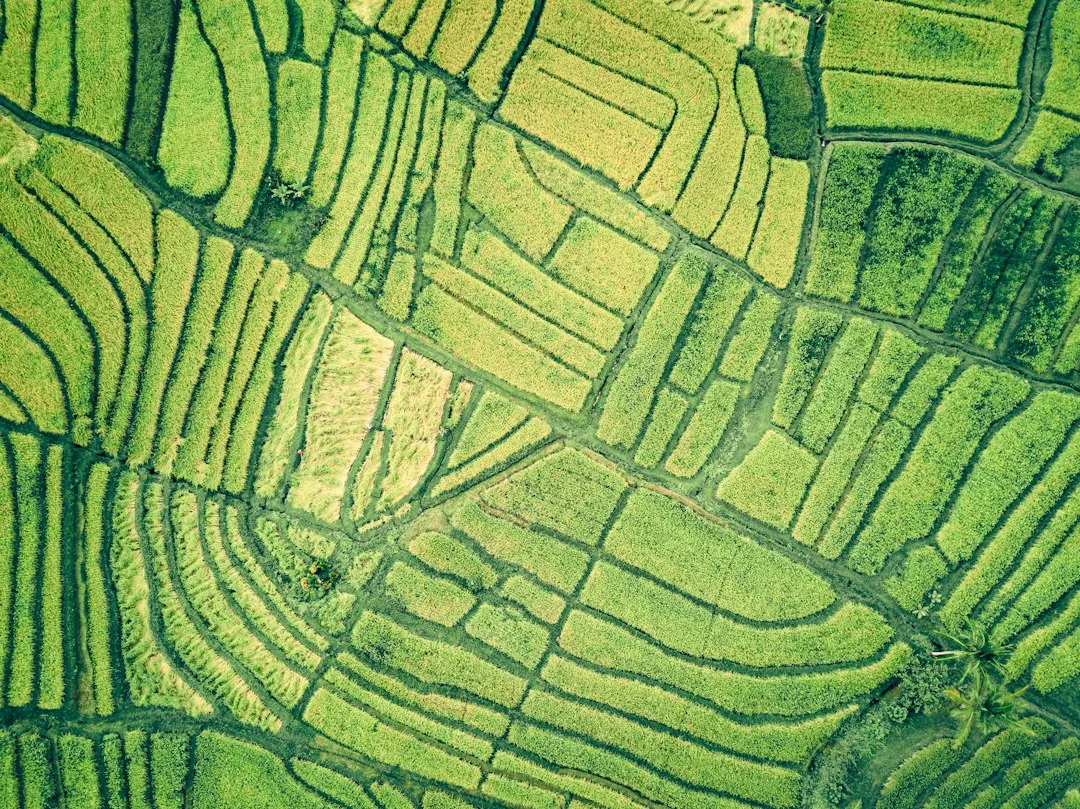
You combine 800 acres of corn across six fields, harvest yield monitor data, average everything, and report 170 bu/ac to yourself. Then you move to next year's plan without asking the critical question: which fields are actually paying rent, and which are stealing profit? Inter-field yield comparison answers that. It is the systematic measurement of yield performance across your separate fields to identify which fields outperform or underperform your operation average—and why.
Inter-field yield comparison reveals hidden whole-farm performance problems
A 170 bu/ac average masks dangerous truth. If two of your six fields yield 155 bu/ac while two others yield 185 bu/ac, you have a 30 bu/ac spread—worth roughly $90–$120 per acre depending on forward prices. Over 800 acres, that gap represents tens of thousands of dollars left on the table or lost to poor field conditions.
Averaging hides this because strong fields pull up weak fields in your mental model. You think the whole operation is underperforming regionally when in fact three specific fields are the real drag. That invisibility leads to wrong decisions: you spend money on region-wide changes instead of targeting the two or three fields that need diagnosis.
Inter-field comparison breaks that averaging trap. It isolates each field's true yield signature and lets you rank them by performance, cost per bushel, and profit contribution.
Quick Tips
- Rank fields by yield per acre annually, not by total bushels. A 120-acre field yielding 168 bu/ac may be your worst performer even if it produces 20,000 bushels total.
- Track which fields have consistent underperformance (three years running), not one-off bad years caused by weather.
- Map soil type, drainage, and compaction history to your bottom-performing fields; often one or two soil conditions drive the gap.
- Use inter-field comparison to justify investment: if Field 3 consistently yields 15 bu/ac less than Field 1, that gap alone can pay for targeted tile, amendment, or variety testing.
How to structure inter-field yield data for action
Start with clean yield monitor records from each field for at least three years. Extract the average yield per acre for each field, then subtract your whole-farm average from each field average to get the deviation. This number—positive or negative—is your inter-field performance signal.
For example: if your farm average is 170 bu/ac, and Field A averages 178 bu/ac over three years, Field A's deviation is +8 bu/ac. Field B averages 162 bu/ac, so its deviation is –8 bu/ac. Now you can rank and compare.
Create a simple table with field name, acreage, three-year average yield, deviation from farm average, and trend (improving, flat, or declining year-over-year). This ranking immediately shows you where to focus.
| Field | 3-Yr Avg Yield (bu/ac) | Deviation from Farm Avg |
|---|---|---|
| Field A (North) | 178 | +8 (top performer) |
| Field B (East) | 162 | –8 (persistent underperform) |
| Field C (South) | 170 | 0 (farm-average |
| Field D (West) | 168 | –2 (slightly below avg) |
The mistake — ignoring one-year outliers versus catching real field problems
Many producers look at a single bad year in one field—say a 2023 hail event—and assume the field has a problem. Then they blame the same field the next year when drought hits. This is reactive noise, not data.
Real inter-field comparison requires multi-year trend reading. A field that yields 155 bu/ac in Year 1 (drought), 165 in Year 2 (good conditions), and 158 in Year 3 (wet spring) is telling you something consistent, even if no single year is terrible. The field struggles in stress conditions. That is actionable insight—you might invest in improved drainage or choose a drought-tolerant hybrid for that field specifically.
By contrast, a field that yields 175 bu/ac, then 142 bu/ac (hail), then 178 bu/ac has noise, not a problem. Do not spend money on it. Separate signal from noise by looking at three-year averages, not single-year shocks.
Connecting inter-field comparison to soil and practice decisions
Once you rank fields by deviation, dig into the soil and management history of your top and bottom performers. Your top field might have superior drainage, higher organic matter, or a longer crop rotation history. Your worst field might sit on clay, have a compaction layer, or drain poorly.
Soil moisture retention and water movement drive yield stability, so map those first. Pull soil test data—phosphorus, potassium, organic matter, pH—for each field and overlay it against yield deviation. Often a single constraint (low phosphorus or poor drainage) explains most of the gap between your top and bottom fields.
Use this comparison to prioritize EQIP or on-farm practice investment. If your worst field underperforms by 12 bu/ac due to compaction, and cover crops plus reduced tillage can recover half of that gap over five years, the cost-share opportunity is worth pursuing. Quantify the opportunity first using inter-field comparison, then apply for the practice.
Benchmarking your inter-field performance against regional data
Inter-field comparison is a within-farm ranking tool, but you also need to know if your top field is genuinely strong or just less weak than your worst field. That requires regional benchmarking. Yield data interpretation turns raw numbers into field action—comparing your fields against county and state averages tells you which of your fields are truly performing at region standards.
See your state's full yield data to pull your county's historical corn and soybean yield range for the past three to five years. If your top field averages 178 bu/ac but your county top-third farms average 185 bu/ac, your best field still has room to close a gap—maybe through variety choice, timely fungicide application, or fertility optimization specific to that field.
Conversely, if your top field yields 178 bu/ac and your county average is 162 bu/ac, you have identified a genuine competitive advantage. Study that field's soil, management history, and hybrid choice. Consider replicating its practices on your weaker fields.
Using inter-field comparison to plan next season's capital and input allocation
Your ranked field list should guide your input budget and practice decisions. If you have $50,000 to spend on soil health improvements, allocate it first to your bottom two fields—the ones with the largest negative deviations. A small investment in drainage, organic matter building, or compaction remediation on a chronically weak field often delivers higher ROI than spreading the same money across all fields equally.
Similarly, reserve your best hybrid genetics, premium fungicide timing, or optimized seeding rates for your top-performing fields first. That sounds counterintuitive, but it maximizes your marginal return. A field already yielding 178 bu/ac responds well to premium inputs; a field stuck at 162 bu/ac may have a constraint that inputs cannot overcome until soil or drainage is fixed.
Inter-field yield comparison is not about judgment or shame. It is about identifying where your operation has money left on the table and systematically allocating resources to recover it. Rank your fields, understand their constraints, and invest accordingly. That discipline delivers compounding profit growth season after season.
Try the Calculator
Estimate the payback on variable-rate seeding, zone-based fertility, and overlap reduction for your farm.
Estimate only — based on industry-average implementation costs (variable-rate seeding $18/ac, zone-based fertility $22/ac, overlap reduction $9/ac; $12,000 fixed + $17/ac ongoing) and USDA yield benchmarks, not a quote. Prices: USDA NASS national price received, Aug 2026 (updated automatically). See your state's full yield data →
See your state's full yield data: See your state's full yield data.
Frequently Asked Questions
What is the minimum number of years of yield data I need to compare fields fairly?
Three years is the practical minimum; it filters out most one-off weather events while remaining recent enough to reflect current soil and management. If you have five or more years, use that—longer trends are stronger signals. Avoid making field investment decisions on a single year of data.
How do I account for different soil types when comparing field yields?
Map soil type against yield deviation. If Field A (clay, poor drainage) underperforms by 10 bu/ac and Field B (silt-loam, well-drained) outperforms by 8 bu/ac, the soil difference explains the gap. Then focus your practice investment on Field A—targeted drainage or organic matter building—rather than assuming both fields need the same treatment.
Should I use inter-field comparison to select which fields to rent out or sell?
Not without understanding why a field underperforms. A weak field may underperform because it lacks drainage (fixable), not because it is inherently poor ground. Before making a retention decision, diagnose the constraint. Many 'bad' fields become solid performers once a real problem is addressed.
Can inter-field comparison help me negotiate crop insurance or FSA loans?
Yes. A clear inter-field yield history shows FSA or lenders that you track performance by field and have a management plan. It also documents your baseline yield per field, which can support insurance coverage discussions. Clean data builds credibility with both programs.
What if one field is consistently better than all others—should I change my rotation or crop mix on that field?
Not automatically. Your best-yielding field may be best because it fits your rotation, soil type, and drainage—changing crops could destroy that advantage. First understand why it performs well (soil health, drainage, residue management), then replicate those conditions on weaker fields rather than disrupting your winner.
How often should I update my inter-field comparison ranking?
Annually after harvest, once yield data is clean. A rolling three-year average is most useful; it incorporates the newest year while smoothing out single-year noise. Review rankings every fall to plan next year's capital and input allocation.
Related Articles

Related: Grain Moisture Correction Makes Your Yield Numbers Comparable
Related: Harvest Loss Measurement Shows What Your Yield Monitor Misses