
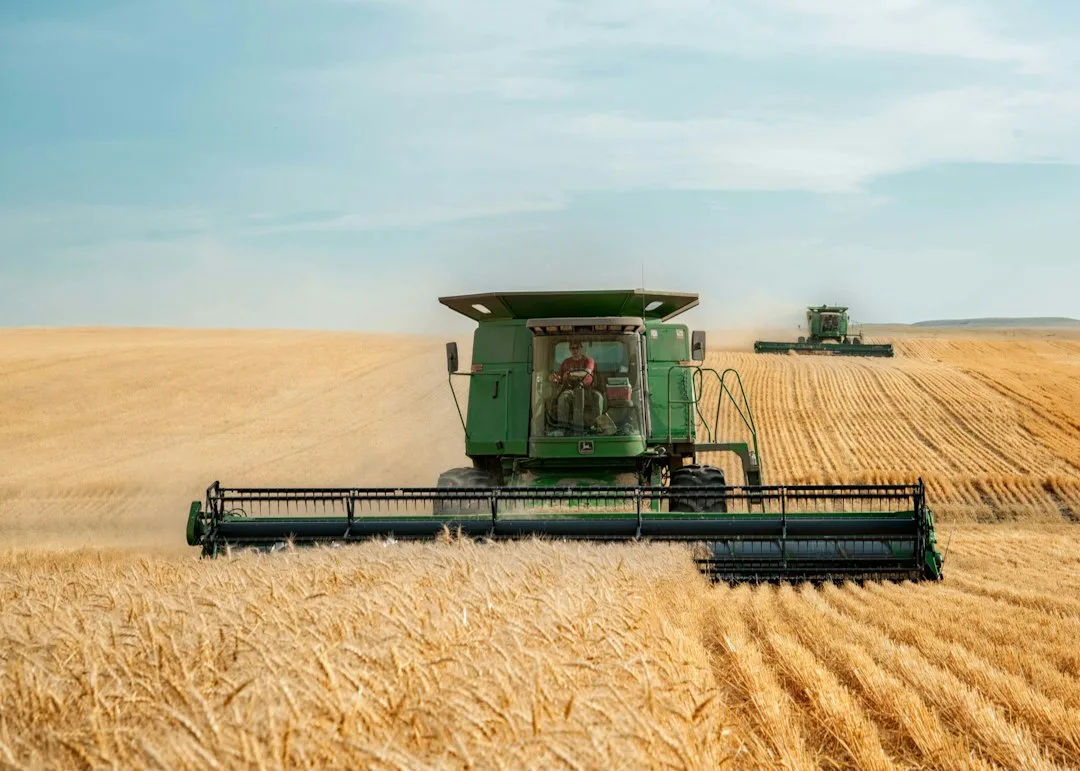
Yield monitoring consistency across seasons is the single biggest—and most overlooked—prerequisite for reading your own farm's yield data correctly. If your combine monitor settings, calibration timing, or collection protocol shift from year to year, you cannot tell whether a 5-bushel change is real agronomic progress or simply a measurement artifact. That gap costs real money: it leads to wrong field decisions, missed cost-share opportunities, and false confidence in practices that are not actually working.
See your state's full yield data: See your state's full yield data.
Yield monitoring consistency across seasons improves with proper calibration
Yield monitors measure grain mass, moisture content, and ground speed to calculate per-acre yield in real time. All three sensors drift over time. A moisture sensor that was accurate in 2024 may read 1–2 percentage points high by 2026, inflating your reported yield by 3–5 bushels per acre on dry grain and overstating your progress in fields where you actually made no change.
Ground speed sensors accumulate dirt and calibration error. GPS drift, particularly in rows with tree lines or structures, can misallocate yield to the wrong field area and create phantom yield swings when you compare maps year to year. If you service your monitor every two years but skip the previous season, that year's data carries unknown error margin that contaminates your three-year trend.
The fix is mechanical, not statistical. Before every harvest, check your monitor's calibration status and compare it to the previous year's baseline. If calibration has drifted, note it explicitly in your field records—it is not a failure, it is reality.
Quick Tips
- Calibrate your yield monitor the same week every year—record the date and baseline values in a permanent farm log.
- Use the same harvest window (kernel moisture, weather conditions) across years when possible; variations distort comparisons.
- Document any monitor repairs, software updates, or sensor replacements—these are measurement-method changes, not yield changes.
- Export your raw yield data in the same file format and units each year; unit conversion errors (bu/ac vs. kg/ha) introduce invisible bias.
How Harvest Timing and Moisture Window Shape Your Reported Yield
Two fields harvested at different kernel moistures will report different yields even if their actual dry-grain mass is identical. A field harvested at 22% moisture will show numerically lower yield than the same field harvested at 18% moisture, because the monitor subtracts the weight of water before calculating yield on a 15% standard moisture basis.
If you harvest Field A in week 1 at 20% moisture and Field B in week 3 at 16% moisture, direct yield comparison is misleading. The yield monitor corrects for moisture mathematically, but if your test weights or flow rates vary between weeks, the correction may not be perfectly consistent.
The practice: harvest the same field or set of comparison fields in the same moisture window every year. If weather forces a shift, note it in your data notes and do not compare that year's yield directly to years with different harvest timing without adjusting for the moisture and weather context.
| Scenario | Reported Yield | Comparability Issue |
|---|---|---|
| Field A, 2024, harvested week 2 at 18% moisture | 170 bu/ac | Baseline year, consistent timing |
| Field A, 2025, harvested week 1 at 22% moisture | 166 bu/ac | Earlier harvest, higher moisture—data inflated by conditions, not yield loss |
| Field A, 2026, harvested week 2 at 18% moisture | 169 bu/ac | Matching 2024 window; trend is real and comparable |
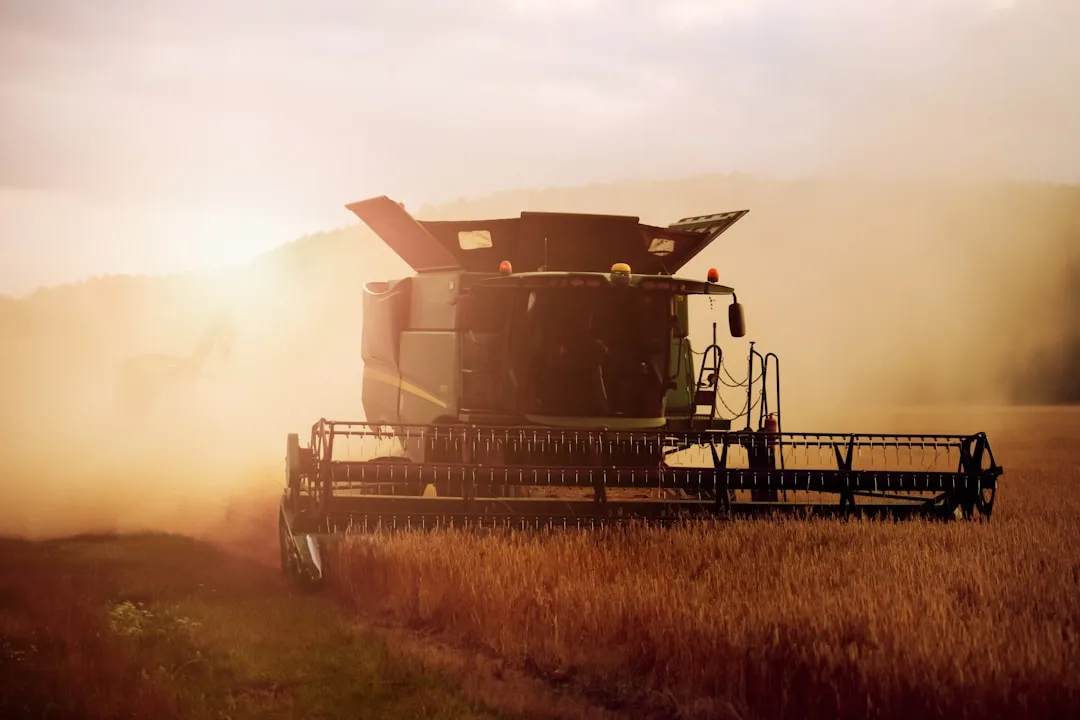
The Common Mistake — Comparing Yield Across Different Monitor Settings
Many producers collect yield data from a new combine one season, switch back to an older machine the next, or upgrade monitor software mid-year and assume the data strings together seamlessly. It does not.
A real example: a farmer compares 2025 yield (new monitor with auto-calibration) to 2024 yield (older monitor, manual calibration) and sees a 7-bushel jump. He attributes it to his new hybrid variety or cover crop work. What actually happened: the new monitor's firmware reports yield 1.5% higher across the board because of a different test-weight algorithm. The real change was 5 bushels, not 7, and the variety or practice gets undeserved credit.
The result: he plants more of that variety in a field where it does not fit, locks into a higher-cost seed contract, or doubles down on a cover crop practice that is not driving yield at all. This mistake compounds over three to five years and costs thousands in wasted inputs.
The only defense is documentation. Record the monitor model, firmware version, and calibration history for every year of data you intend to compare. If you change equipment, treat that year as a transition year and do not directly compare it to prior years—or recalibrate the old data backward if the new monitor allows a side-by-side test.
Standardizing Your Yield Monitoring Protocol Year to Year
A yield monitoring protocol is your written standard for when, how, and where you collect data. It includes harvest window (optimal moisture range), monitor calibration date, file format for export, field-mapping boundaries, and flagged areas (roads, wet spots, skip strips) that you exclude from year-to-year comparison.
Interpreting Year-to-Year Yield Variance with Confidence
Once your data collection and equipment are standardized, the next challenge is separating real yield changes from measurement noise. A 5 bu/ac swing in one field might be noise; the same swing across ten fields in the same year is likely a real agronomic signal. Begin by comparing yields only within the same field boundaries, same harvest window, and same monitor calibration. Then layer in weather records, soil test results, and pest scouting notes from the same calendar period. If soil moisture was limiting one year and adequate the next, or if disease pressure differed, those factors explain yield movement more reliably than equipment drift does.
Trend analysis requires at least three to five years of standardized data before confident conclusions emerge. A single good year or bad year tells you almost nothing about your farming system's true capability. Instead, look for patterns: Does yield consistently climb when you apply a specific practice? Does it drop when you skip a step? Yield Data Interpretation Turns Raw Numbers Into Field Action by connecting those patterns to decisions you can actually make. Similarly, Soil Moisture Retention Drives Yield Stability Across Row Crops reveals how consistent water availability year to year anchors yield performance, making it easier to spot when external factors—not your practices—caused variance.
Document every yield number alongside the conditions that produced it. Over time, your yield data becomes a field-specific benchmark for what your soil, climate, and management are truly capable of delivering.
Try the Calculator
Estimate the payback on variable-rate seeding, zone-based fertility, and overlap reduction for your farm.
Estimate only — based on industry-average implementation costs (variable-rate seeding $18/ac, zone-based fertility $22/ac, overlap reduction $9/ac; $12,000 fixed + $17/ac ongoing) and USDA yield benchmarks, not a quote. Prices: USDA NASS national price received, Aug 2026 (updated automatically). See your state's full yield data →
See your state's full yield data: See your state's full yield data.
Frequently Asked Questions
How often should I calibrate my yield monitor?
Calibrate your monitor at least once per year before harvest season, ideally the same week every year. If you store your combine over winter, calibrate again in early spring. Document each calibration in a farm log with the date and baseline readings.
Does harvest moisture really affect my yield numbers that much?
Yes. A field harvested at 22% moisture will report lower yield than the same field harvested at 18%, even though dry-grain mass is identical. The yield monitor mathematically corrects for moisture, but calibration drift and test-weight variation between seasons can introduce error, so consistent harvest timing helps.
What should I do if I change to a new combine with a different monitor?
Treat the transition year as a measurement-method change, not a yield-change year. Run both machines side-by-side on the same field if possible to compare output, or keep detailed notes on firmware version and calibration baseline. Do not compare that year's yield directly to prior years until you understand the offset.
How do I know if my yield trend is real or just measurement drift?
Compare your farm's trend to your county or region's USDA yield trend over the same years. If your farm and the region both rise 3–4 bu/ac year-over-year, your trend is likely real. If your farm bounces randomly while the region trends smoothly, measurement consistency may be the issue.
Should I recalibrate old harvest data if I get new equipment?
If your new monitor allows a side-by-side test of both machines on the same field, you can calculate an offset and apply it backward. Otherwise, keep old and new data separate and note the equipment change in your records—do not force a false comparison.
Related Articles
Related: Nitrogen Carryover and Residual Soil Nitrate Reduce Your Yield Potential
Related: Inter-field yield comparison reveals which fields drive farm profit