
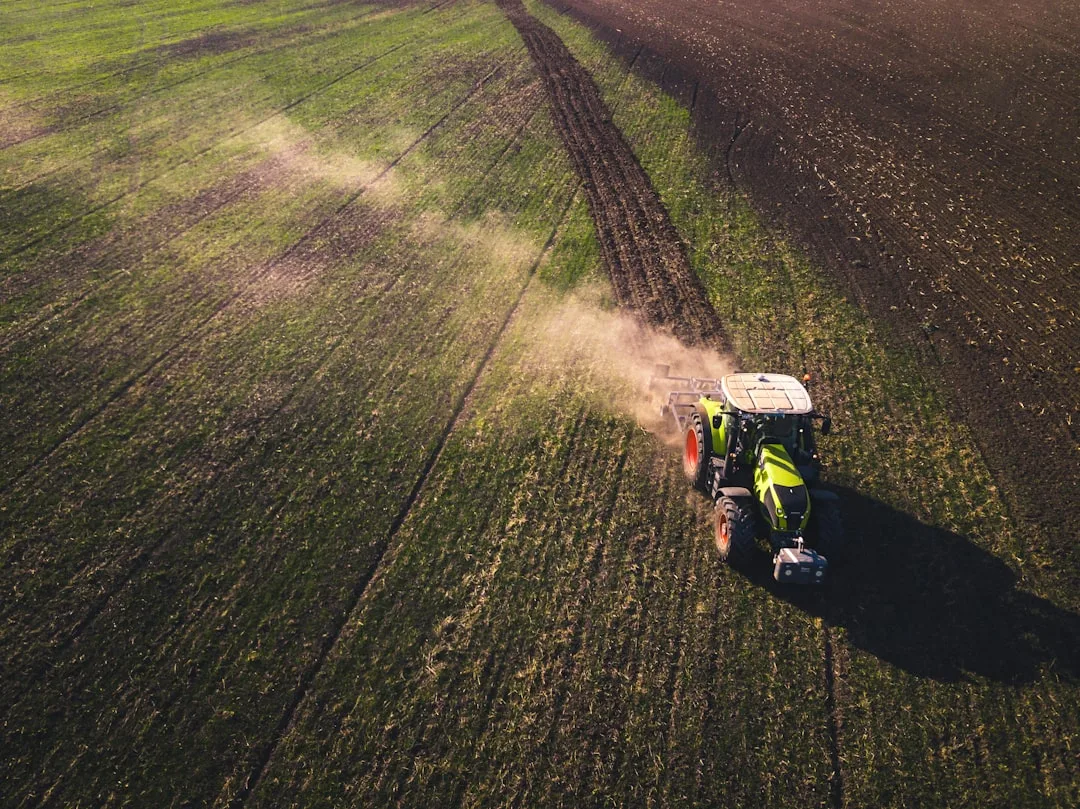
Soil compaction is invisible until it shows up in your yield map. Unlike a replanted section or a herbicide miss, compaction does not announce itself—it reduces yield gradually, acre by acre, season after season. Soil compaction and yield loss is one of the costliest invisible problems on US row-crop farms because it persists, multiplies, and ties directly to the decisions you made years ago. The good news: yield data can quantify it, and you can reverse it.
How Soil Compaction Translates to Measurable Yield Drag
Compaction restricts root penetration, reduces water infiltration, and limits nutrient uptake. Each of these factors independently depresses yield; together, they create a yield penalty that compounds year after year.
When you measure yield across a field, a chronically compacted zone will produce 5–15% less grain than adjacent, well-structured soil—not because genetics differ or rain missed that spot, but because the soil cannot deliver what the plant needs. That difference is quantifiable, repeatable, and—critically—traceable to soil structure rather than weather or management variation.
The challenge is distinguishing compaction loss from other yield drags. This is why yield data interpretation turns raw numbers into field action. When you map yield, overlay traffic patterns, and compare multi-year trends in the same zones, compaction signals emerge.
Quick Tips
- Use yield maps from the same field across 3+ years; consistent low-yield zones suggest compaction, not random weather.
- Map grain cart and combine traffic routes; compare yields in high-traffic areas to adjacent rows.
- Soil penetrometer readings quantify compaction depth; pair them with yield data from the same spot.
- Compaction recovery takes 2–4 years; plan tillage or cover crops accordingly and track yield recovery in those zones.
Traffic Patterns and Yield Variability Connect Directly
Every pass of a loaded grain cart, combine, or application rig adds pressure. Modern equipment weighs 30,000–50,000 lbs and concentrates that load into narrow tire footprints, creating pressure zones that far exceed root-zone strength thresholds.
If your grain cart always follows the same headland path, or your sidedress applicator runs the same tram lines every year, those routes accumulate compaction. Yield maps will show linear patterns—a repeating stripe of lower yield that mirrors your equipment traffic path.
| Traffic Scenario | Yield Pattern Signal | Detection Method |
|---|---|---|
| Single annual grain cart path | Narrow linear stripe, same location year-to-year | Overlay yield maps on field diagram |
| Randomized traffic routes | Diffuse, lower-yield zone; no clear stripe | Compare soil density readings to yield |
| Wet-season operations | Deep compaction below 8 inches; multi-year persistence | Penetrometer plus 3-year yield trend |
| No compaction control | Progressive yield decline; recovery takes 3+ years | Year-to-year yield comparison same zone |
The Hidden Cost of Ignoring Compaction Signals
Most farmers see compaction data—from soil tests, penetrometer readings, or yield maps—but delay action because recovery appears slow. That is the #1 mistake: underestimating the cumulative cost of inaction.
Consider an example: a 20-acre compacted zone in a 160-acre field producing 8–10 bu/ac less corn than the rest of the field. Over one season, that is 160–200 bu of lost grain. At typical commodity prices, that translates to $800–$1,200 in lost revenue per year. Spread across five years without intervention, that compaction costs you $4,000–$6,000—more than most regenerative tillage or cover crop practices cost to implement.
Worse: compaction deepens each season. Untreated zones become progressively harder to recover; break-even timelines stretch to 4–5 years. Many farmers delay, lose years of yield, then spend on remediation anyway—but late.
Soil moisture retention drives yield stability across row crops, and compaction directly undermines both. Compacted soil drains poorly in wet years and dries hard in dry years, amplifying weather sensitivity and widening your yield variability.
Quantifying Compaction Recovery and Return on Investment
If you implement a compaction-reduction practice—strip-till, cover crops, or reduced-traffic management—how do you measure recovery? Yield data.
Track the same compacted zone for 3–4 years post-intervention. Healthy compaction recovery shows a 1–3 bu/ac annual yield gain in that zone, compounding as soil structure rebuilds. Capture that data, calculate the total grain recovered, and subtract practice costs to verify ROI. This is not guesswork; it is documented, reproducible proof.
Most EQIP cost-share programs reward soil-health practices (cover crops, reduced tillage, diversified rotations) that combat compaction. Your state's NRCS office publishes current practice payment rates. See your state's full yield data to identify which fields carry the highest compaction penalty—then prioritize them for cost-share application.
Building a Multi-Year Compaction Baseline
Start now: collect yield maps for the past 3–5 years, if available. Stack them visually or in a spreadsheet, looking for zones that consistently underperform regardless of weather conditions that year.
Note the location, size, and severity. Record your equipment traffic paths for the same years. Cross-reference soil-test bulk density or penetrometer data if you have it. This baseline becomes your compaction hypothesis—concrete, data-backed, and actionable.
Once you have a baseline, monitor that zone annually. After intervention (whether tillage, cover crop, or traffic management change), expect slow, steady improvement over 2–4 seasons. Document each year's yield in that zone. That recovery curve is your proof point for future decisions and for demonstrating program impact to lenders, NRCS partners, or your own planning.
Why Soil Compaction Yield Loss Matters More Than One Season
Compaction is a long-term yield tax. A single bad season feels temporary; compaction persists, accumulates, and silently shrinks your bottom line year after year.
The farms that outpace their regions do not ignore compaction signals. They detect them early via yield maps, quantify the cost, and act within 1–2 seasons of recognition. That discipline—translating data into action—recovers thousands of dollars per field over a decade.
Your yield data is already a diagnostic tool. Use it. Map consistently, interpret the patterns, and act on compaction before inaction becomes the costliest decision you make.
Try the Calculator
Estimate the payback on variable-rate seeding, zone-based fertility, and overlap reduction for your farm.
Estimate only — based on industry-average implementation costs (variable-rate seeding $18/ac, zone-based fertility $22/ac, overlap reduction $9/ac; $12,000 fixed + $17/ac ongoing) and USDA yield benchmarks, not a quote. Prices: USDA NASS national price received, Aug 2026 (updated automatically). See your state's full yield data →
See your state's full yield data: See your state's full yield data.
Frequently Asked Questions
How can I tell if yield loss is from compaction or weather?
Compaction appears as a consistent yield depression in the same field zones across multiple years, regardless of weather variation. Weather effects shift; compaction does not. Overlay yield maps from 3+ years—compaction zones repeat.
What yield loss should I expect in compacted soil?
Compacted zones typically yield 5–15% below adjacent, healthy soil. In corn, that can mean 5–12 bu/ac loss; in soy, 2–4 bu/ac. Severity depends on compaction depth and soil type.
How long does compaction recovery take?
With active remediation (reduced traffic, cover crops, or strategic tillage), expect 2–4 years for meaningful yield recovery. Untreated compaction persists indefinitely and often worsens.
Can I get cost-share funding for compaction remediation?
Yes. EQIP typically funds soil-health practices like strip-till, cover crops, and residue management that address compaction. Contact your local NRCS office for current practice codes and payment rates in your state.
Should I use a penetrometer to confirm compaction?
Yes. Penetrometer readings quantify soil strength at depth. Pair them with yield map data from the same zone to connect compaction (measured by soil density) directly to yield loss (measured by yield data).
Related Articles


Related: Why Yield Monitoring Consistency Across Seasons Matters for Your Farm
Related: Nitrogen Carryover and Residual Soil Nitrate Reduce Your Yield Potential