
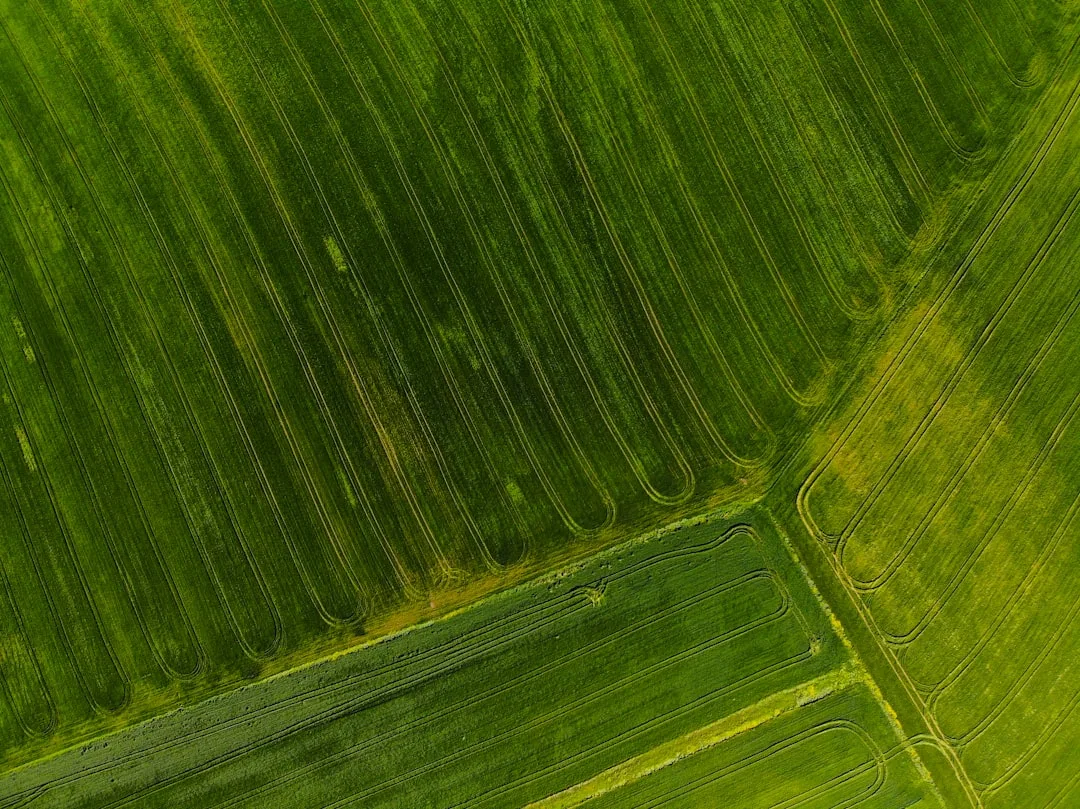
Most row-crop farmers look at their combine monitor or elevator ticket and see a farm average. Field-level yield mapping breaks that number into zones — usually a quarter-section or smaller — so you can see exactly where your acres produce strong and where they leave bushels on the ground. A farm averaging 165 bu/ac might have one quarter at 175 bu/ac and another at 152 bu/ac. That 23-bushel spread tells a story. Field-level yield mapping is the tool that makes the story visible.
Here's why it matters: a single farm average hides failure. You fix what you can't see. Once you map yield by zone, you can isolate the cause — soil, drainage, compaction, pest pressure, or variety choice — and test a remedy on a small patch before rolling it out across 80 acres. That's the difference between guessing and knowing.
See your state's full yield data: See your state's full yield data.
Field-level yield mapping requires clean combine data and GPS accuracy
Your combine's yield monitor logs data continuously during harvest. Paired with GPS coordinates, that stream becomes a spatial dataset. But raw monitor data is noisy: it lags 10–15 seconds behind the actual position, it spikes and dips with operator throttle changes, and it includes startup/shutdown artifacts.
Before you map, you must clean that data. Remove the first and last minute of each pass (transition noise). Filter outliers — if a monitor reads 300 bu/ac surrounded by 165 bu/ac readings, it's sensor drift, not reality. Interpolate missing values over small gaps. Good cleaning cuts out 10–20% of raw records.
GPS accuracy matters too. Most modern combines use standard GPS (5-meter accuracy). Higher-accuracy RTK (centimeter-level) exists but costs more. For zone mapping at 40-acre resolution, standard GPS is usually sufficient. For precision spot-treatment, RTK helps.
Quick Tips
- Export your combine data to a CSV file; most monitors support this. Verify your GPS unit was synced to the field boundary before harvest.
- Use free mapping tools (QGIS, Web Soil Survey overlay) or low-cost platforms to grid your field and sort monitor data by zone.
- Start with a coarse grid (quarter-sections) in year one. Refine to smaller zones once you confirm the pattern repeats.
- Record zone-level fertility, pest, and drainage notes in a field journal alongside your map. Pattern + cause = action.
Comparing Yield Maps to Soil and Drainage Patterns Isolates Root Cause
Once you have a clean yield map, overlay it with soil type and elevation data. Both are available free via Web Soil Survey and are usually accurate to the field. A yield zone that tracks perfectly with soil series — say, 8 bu/ac higher where silty loam dominates — tells you soil texture is a constraint.
Drainage is the second overlay. Wet-season yield dips in low-lying sections? Check contour lines and historical drainage maps. Many Corn Belt fields have tiled sections; your EQIP records or county Extension office can show where.
Understanding Soil Moisture Dynamics in Yield Zones
Soil texture and structure directly control how water moves through your field. Clay-rich zones retain moisture longer, which can benefit crops during dry periods but may waterlog during wet springs. Sandy or silty sections drain faster and warm earlier in the season. When yield zones align with soil texture boundaries, moisture availability often drives the pattern. Soil Moisture Retention Drives Yield Stability Across Row Crops explains how consistent moisture management improves performance in marginal zones. Conduct a soil pit observation at the boundary between high and low-yielding areas to measure soil color, texture, and root penetration depth. Roots that stop abruptly indicate a compacted layer or drainage restriction.
Nutrient Availability and Soil pH Stratification
Yield zones frequently correspond to changes in soil pH and nutrient cycling. Acidic pockets reduce phosphorus and potassium availability, while alkaline spots can lock up micronutrients. Take soil samples from both the productive and underperforming zones—include separate samples from topsoil and subsoil layers. Laboratory results often reveal striking pH differences that explain yield patterns. Precision soil sampling across zone boundaries reveals whether lime or sulfur applications, or targeted fertility adjustments, could narrow the performance gap. Organic matter content also varies with soil type and history; areas with higher organic matter typically show better nutrient buffering and water-holding capacity.
Converting Yield Analysis Into Management Decisions
Raw yield data becomes actionable only when you link map patterns to soil conditions and past management. Yield Data Interpretation Turns Raw Numbers Into Field Action walks through the process of translating patterns into specific interventions. Start by documenting which yield zones respond to drainage improvement, which benefit from added fertility, and which are limited by shorter growing seasons or shade. Once you identify the primary constraint in each zone, prioritize the highest-impact and most cost-effective fix. Some zones may require years of gradual amendment; others respond quickly to tile installation or compaction relief. Document baseline yield levels, implement one change at a time, and monitor the following seasons to measure improvement
Try the Calculator
Estimate the payback on variable-rate seeding, zone-based fertility, and overlap reduction for your farm.
Estimate only — based on industry-average implementation costs (variable-rate seeding $18/ac, zone-based fertility $22/ac, overlap reduction $9/ac; $12,000 fixed + $17/ac ongoing) and USDA yield benchmarks, not a quote. Prices: USDA NASS national price received, Aug 2026 (updated automatically). See your state's full yield data →
See your state's full yield data: See your state's full yield data.
Frequently Asked Questions
What is the minimum field size where yield mapping makes sense?
Yield mapping works on fields 20 acres and larger. Smaller fields have high edge-effect noise in combine data. Start with quarter-sections (40 acres) to establish patterns, then refine to smaller zones once you confirm repeatability.
How do I know if my combine's yield monitor is accurate enough to map?
Compare monitor totals to your elevator tickets for the season. If they're within 2–3%, the monitor is reliable for mapping. If off by more than 5%, have the sensor cleaned or recalibrated before harvest.
Can I use yield maps from a corn year to guide my soybean variety next year?
Partially. Soil and drainage patterns are constant, so if corn underperformed in a low spot due to drainage, soybeans likely will too. But pest and disease pressure may differ by crop, so don't rely solely on corn data to pick soybean genetics.
What's the best grid size for mapping a 160-acre field?
Start with quarter-sections (40 acres each) in year one. That's coarse enough to smooth GPS and monitor noise but fine enough to spot real zones. Once you see a pattern, refine to half-quarter or smaller zones in subsequent years.
Should I share my yield maps with my crop insurance agent?
Yes. Maps help document legitimate yield variance across your farm, which supports your historical-yield records and can help clarify insured yields by zone if you customize your policy.
Can weather-adjusted yield comparisons replace yield maps for finding problem areas?
No, they serve different purposes. Weather-adjusted comparison shows your regional performance relative to peers. Yield maps show where within your own field you're weakest, allowing you to diagnose and fix specific zones.
Related Articles
Related: Hybrid Variety Selection and Yield Response Vary by Region
Related: Soil Compaction and Yield Loss Detection Across Your Farm